Investigating and Solving a Production Memory Spike Issue

Background
The project went live. Everything was normal during development and testing. After going live, within a week, the project started running slower and slower - it took 30 seconds to enter the admin interface. When I first heard this, I thought "Impossible! We're still in internal testing with barely any users." But when I opened the system myself and waited forever to get in, I believed it.
Investigation
Checking Error Logs
Knowing there was a problem, but unable to access the production system directly, I requested access. The ops team took me to the server room - security was tight. I checked the error logs but found no key information. I asked the ops team to export the error logs for me to study, but was firmly denied...
Checking Process Status
Using:
ps -aux | grep ***
To locate the process PID, then:
top -p <PID>
To check memory usage. Although this system is fairly large, it was consuming 4GB of memory - scary.
Using jmap to Check Runtime Memory Information
jmap -histo <PID>
A stream of text appeared. Here's a screenshot I reproduced locally later:
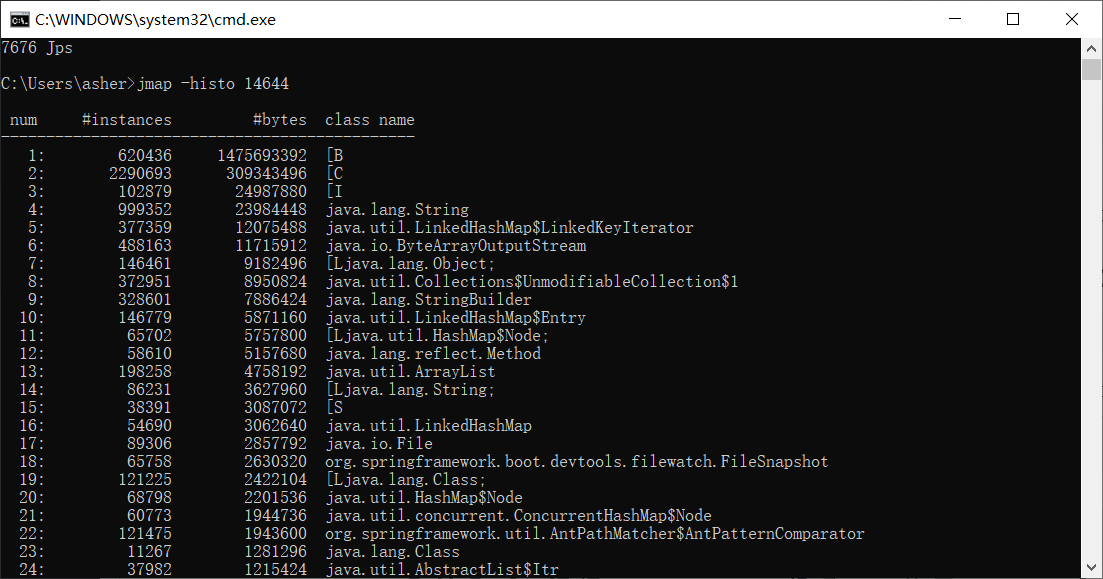
Let me explain what's in this image:
- num: sequence number
- instances: object instances
- bytes: size occupied
- class name: class name, B is byte[], C is char[], I is int[], S would be short[]
I noticed something: "Why are there so many byte[]!!! Does the project use byte[] anywhere? Doesn't seem like it. Maybe they're produced by other objects, like file streams, read/write operations. Ah, I got it - could someone have forgotten to close a stream?"
I asked the ops team if I could take photos - since I couldn't export files, surely photos would be okay? Ops: "No! What are you thinking!"
No choice, let's look at other things.
Checking Heap Information
jmap -heap <PID>
 I don't remember the exact situation at the time - I glanced at it briefly while still thinking about the byte[] issue.
Since I was already there, let me check more information.
Checking GC Status
jstat -gc <PID> 1000(interval) 10000(count)
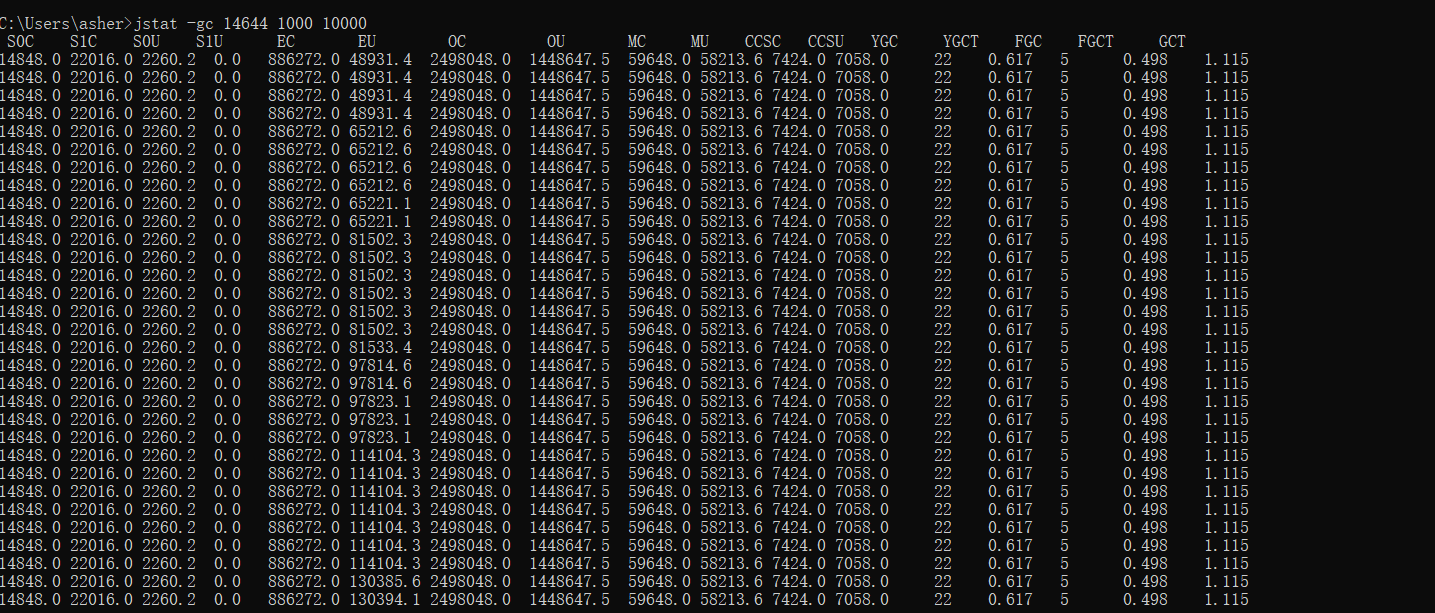
In the image:
- S0C: First survivor space size
- S1C: Second survivor space size
- S0U: First survivor space used
- S1U: Second survivor space used
- EC: Eden space size
- EU: Eden space used
- OC: Old generation size
- OU: Old generation used
- MC: Metaspace size
- MU: Metaspace used
- CCSC: Compressed class space used
- YGC: Young generation GC count
- YGCT: Young generation GC time (seconds)
- FGC: Full GC count
- FGCT: Full GC time (seconds)
- GCT: Total GC time (seconds)
At the time, Full GC was triggering extremely frequently. I used my phone to make a request to the external URL - before I could click a few features, Full GC triggered. I was mortified. Good thing the ops team didn't understand what I was doing, otherwise it would have been embarrassing.
Normally, Full GC should trigger every few hours or days, and Young GC every few minutes or hours. In this situation, I noted the features I had just clicked - that code was likely problematic.
Feeling like I'd seen enough, and with ops constantly asking if I was done (it was after hours), let me check for deadlocks.
Using jstack to Find Deadlocks
Let me also document jstack usage - good thing I brought my tablet with reference materials:
- Use
top -p <PID>to show Java process memory, where pid is the Java process number - Press H to get memory info for each thread
- Find the thread ID with highest memory and CPU usage
- Convert to hex to get the thread's hex representation, e.g., 0x2365
- Execute
jstack <PID>|grep -A 10 2365to get 10 lines after thread 2365 in the stack trace - Check the corresponding stack info to find potentially problematic code
OK, no deadlocks.
Reproducing the Issue
Reproducing this locally was actually easy - since the production machine with 32GB RAM had issues within 7 days, locally I could use tools like jvisualvm or jprofile for real-time monitoring.
I used jprofile - quite a powerful tool.
Using jprofile
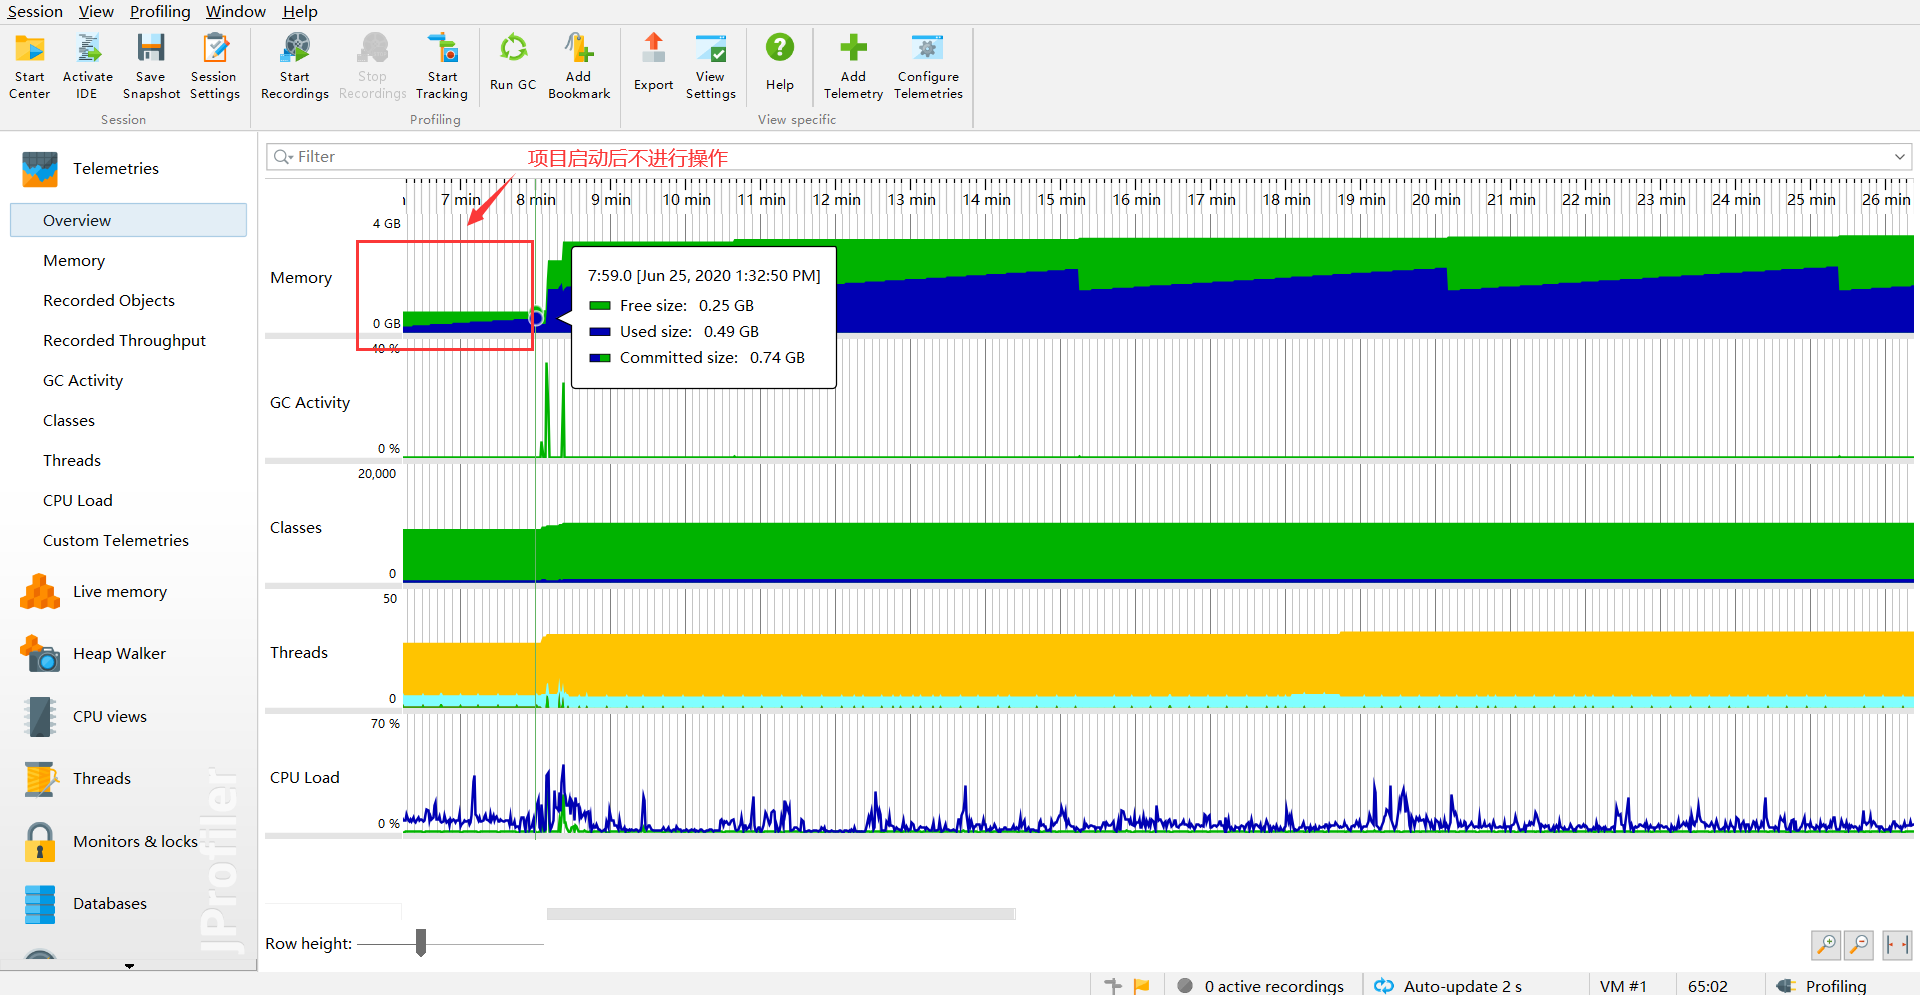
Project Startup
After starting the project without any requests, it looked normal - used size under 500M:
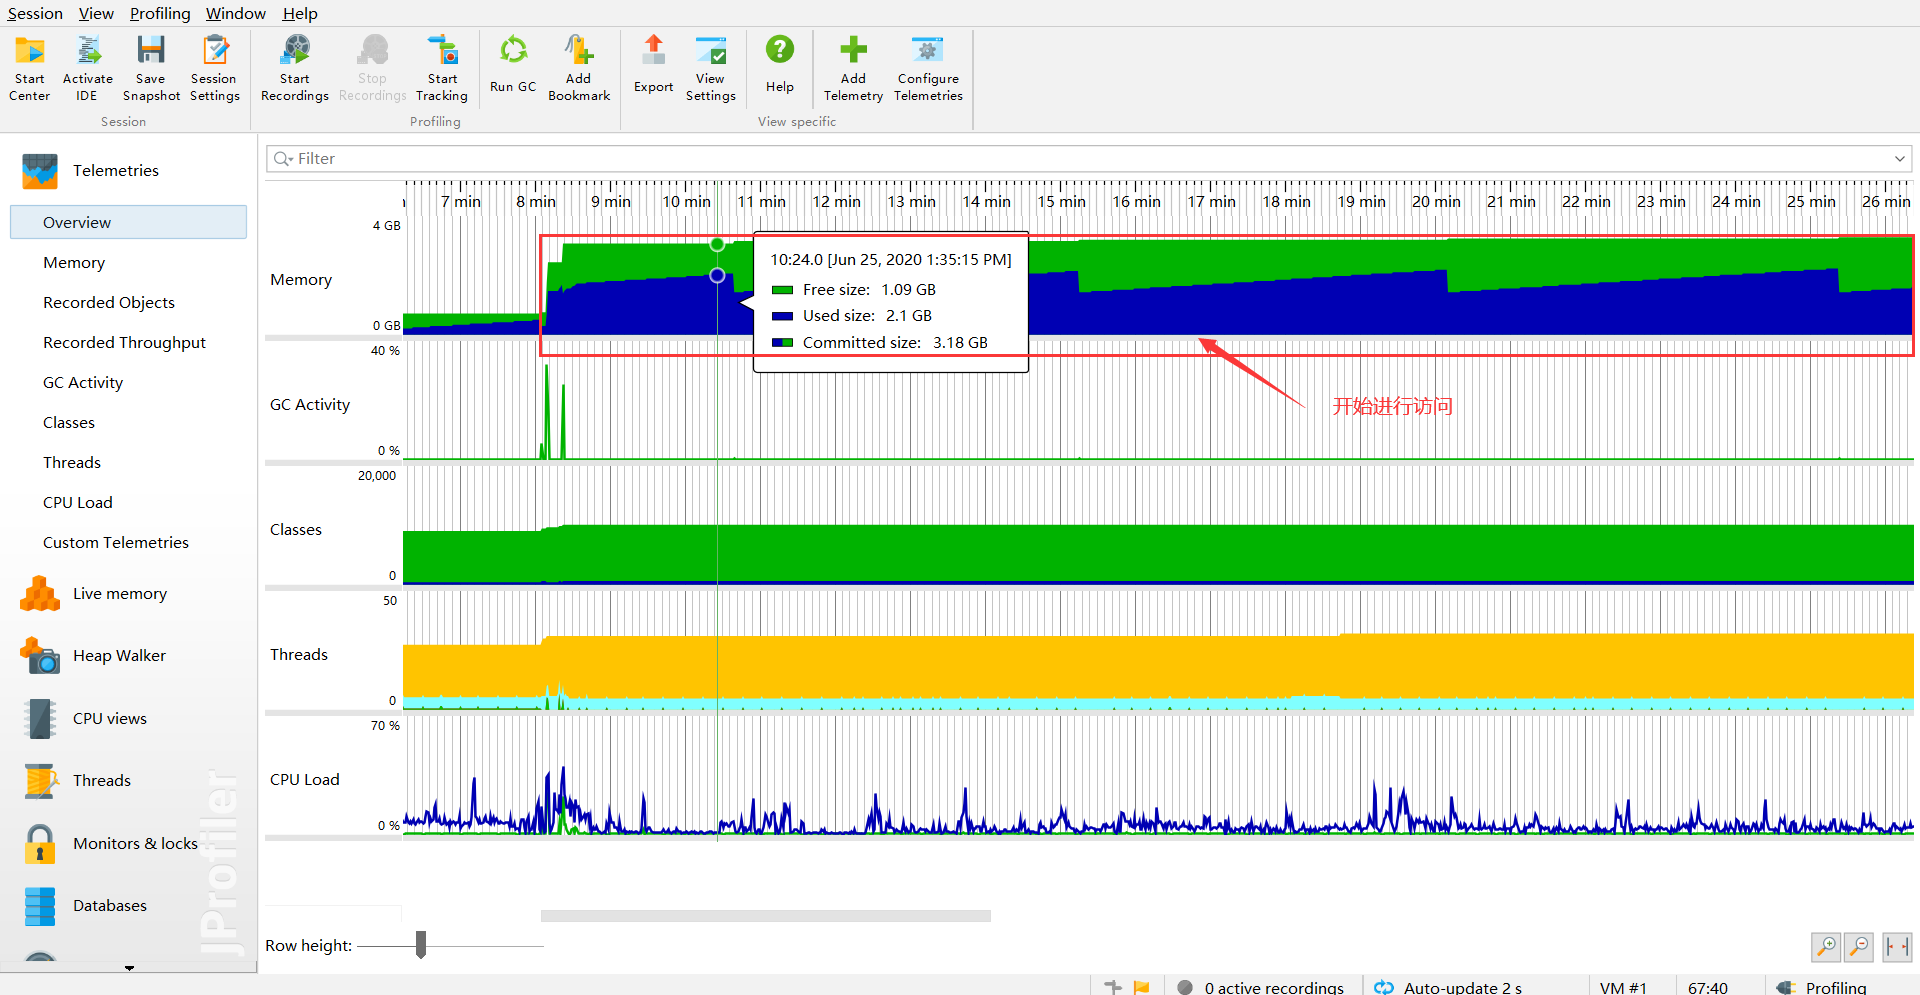
Normal Requests
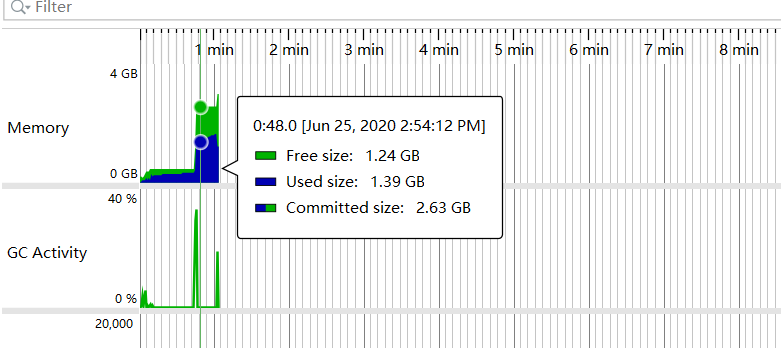
Started making requests - instantly jumped to 2G:
Manual GC Trigger
After manually triggering GC, what remains must be objects that can't be garbage collected:

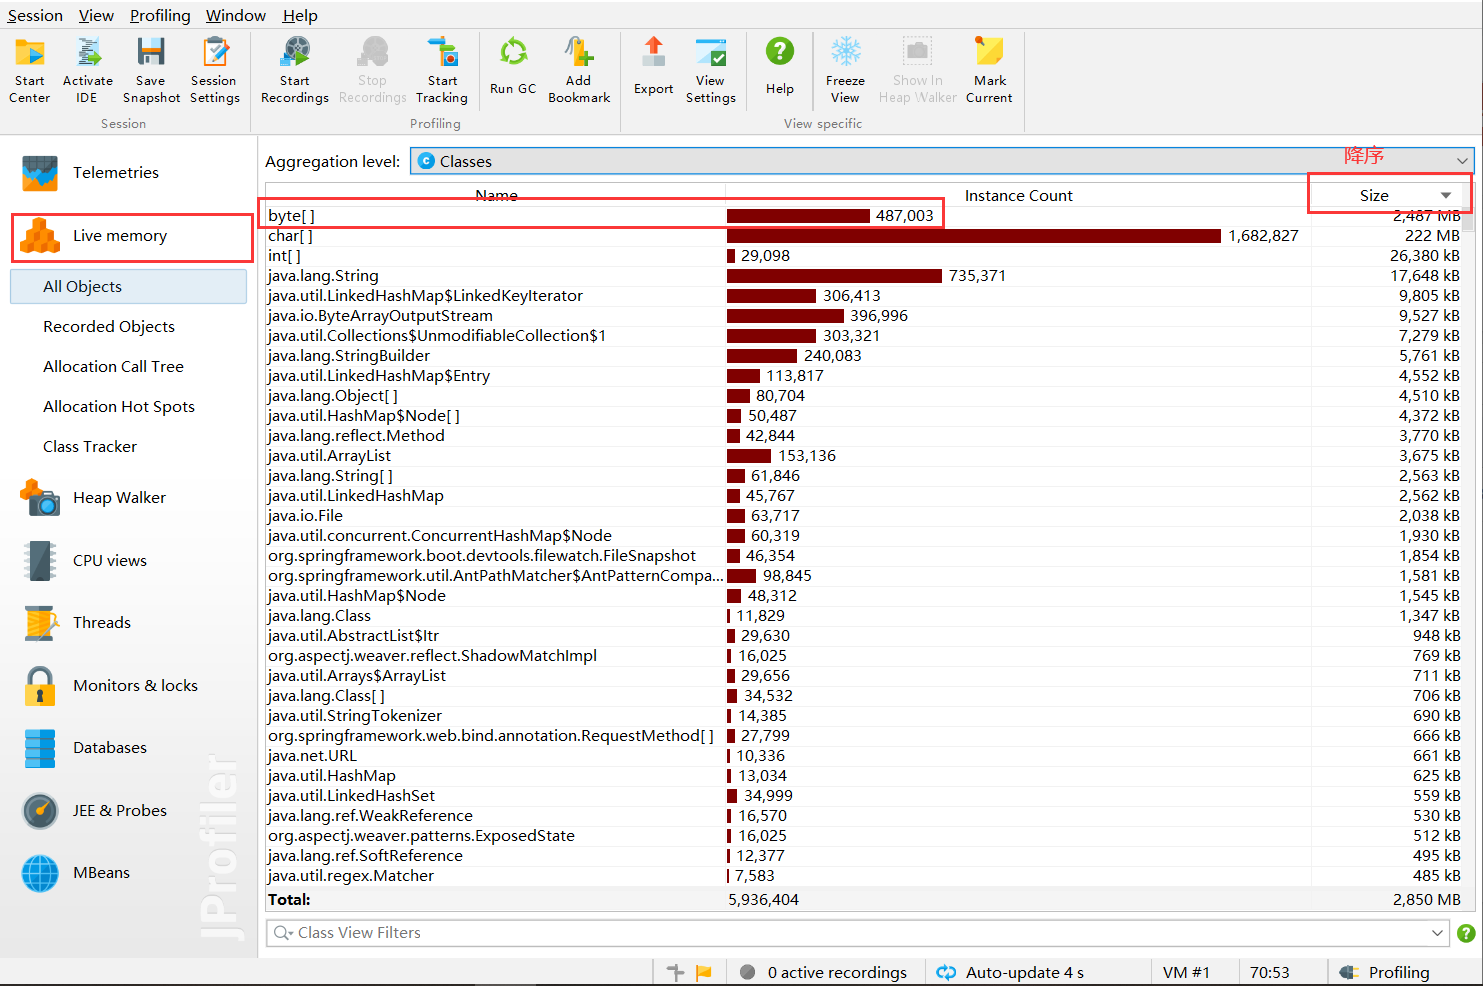
Checking Live Memory
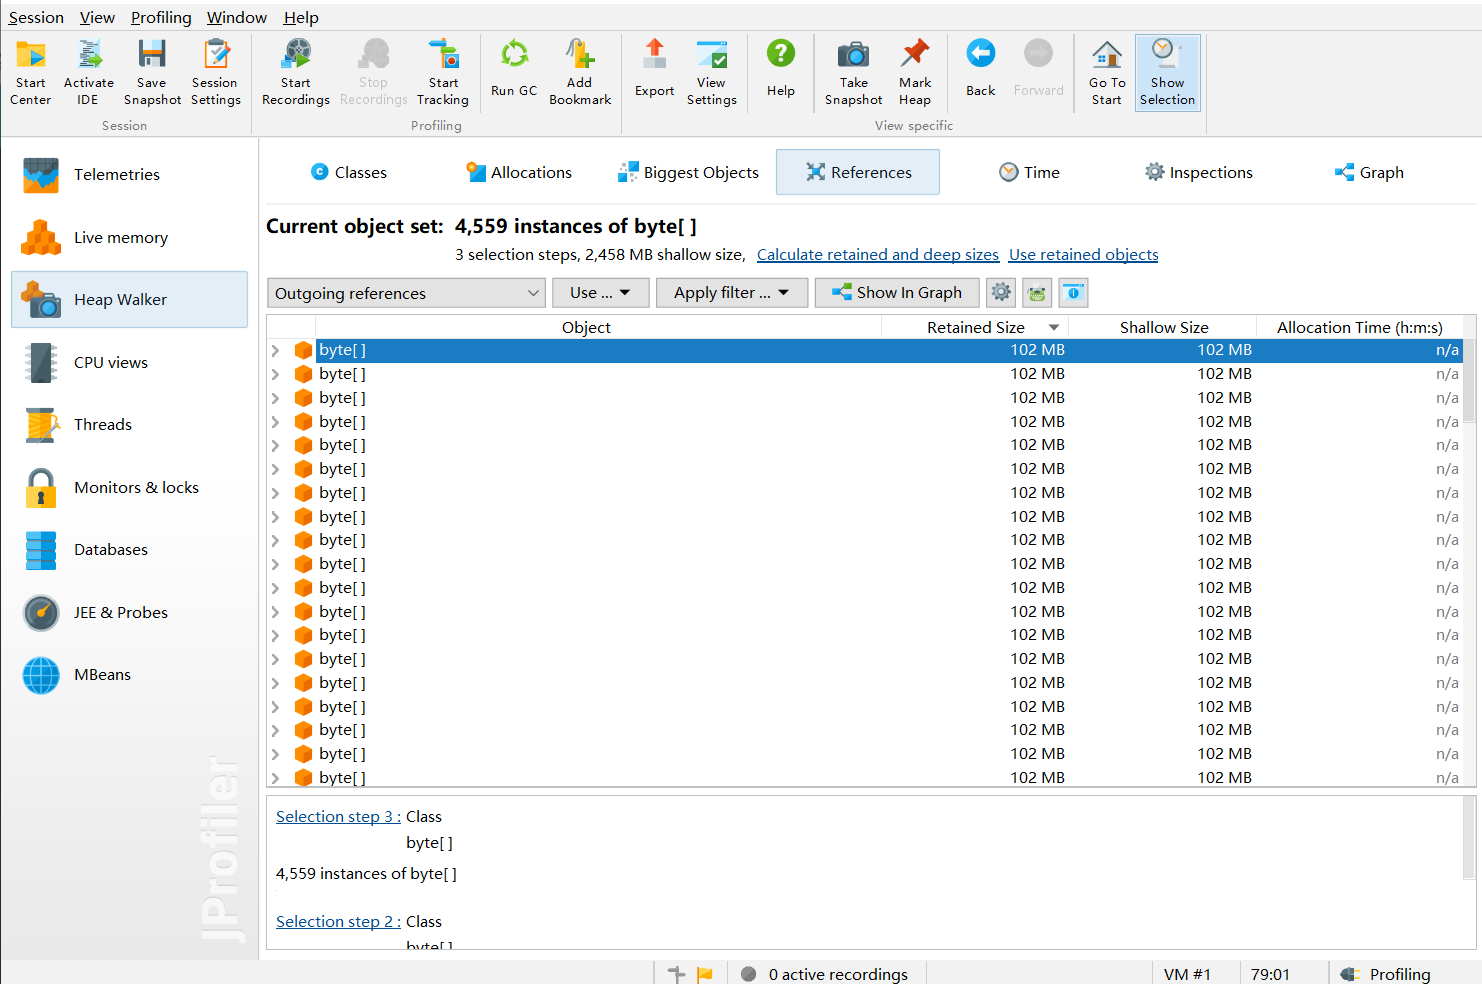
Sure enough, byte[] was the biggest:
Object Analysis
Select the object for display:
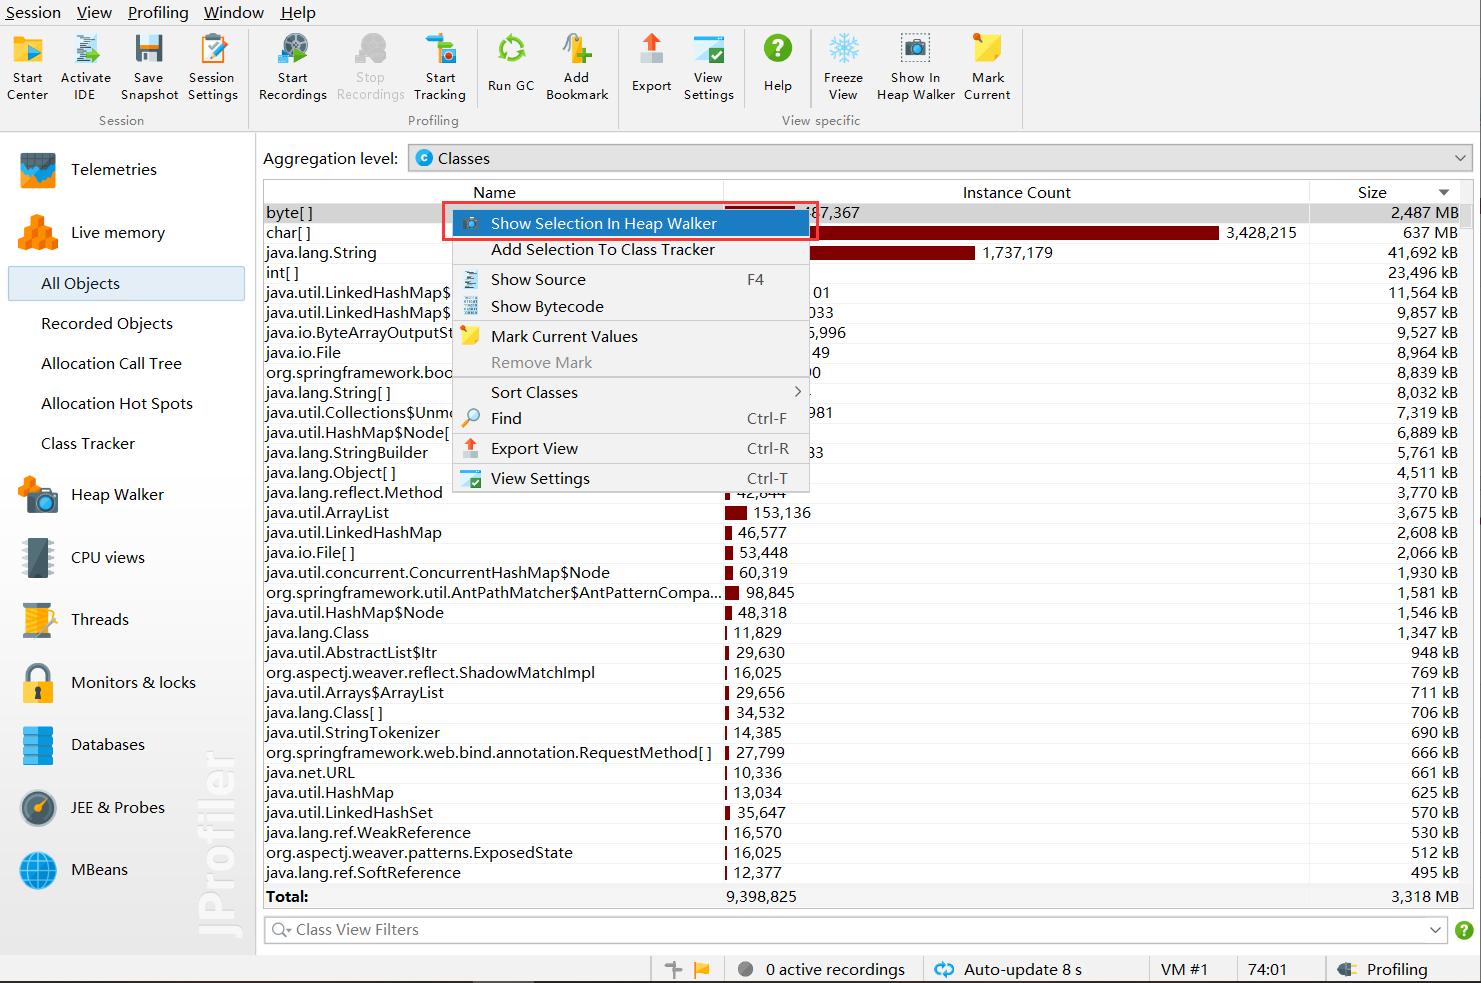
Enter the interface:
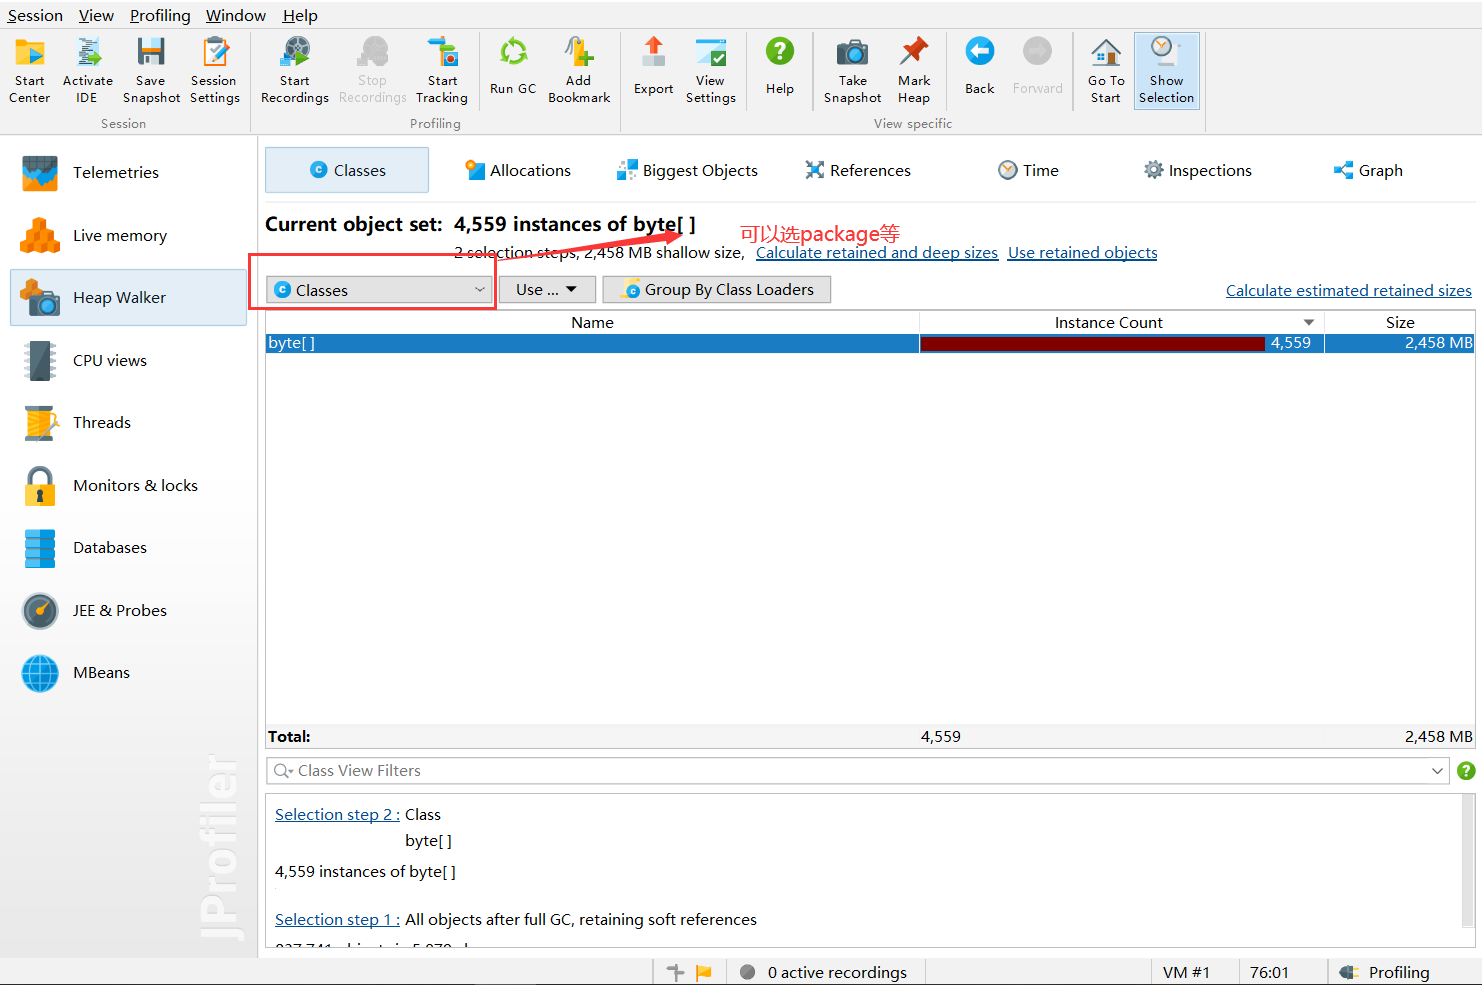
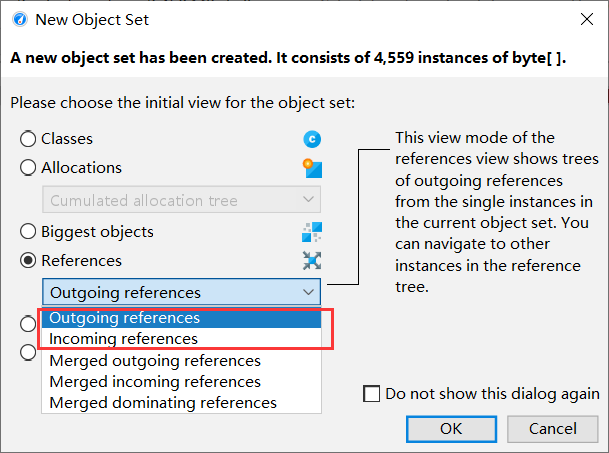
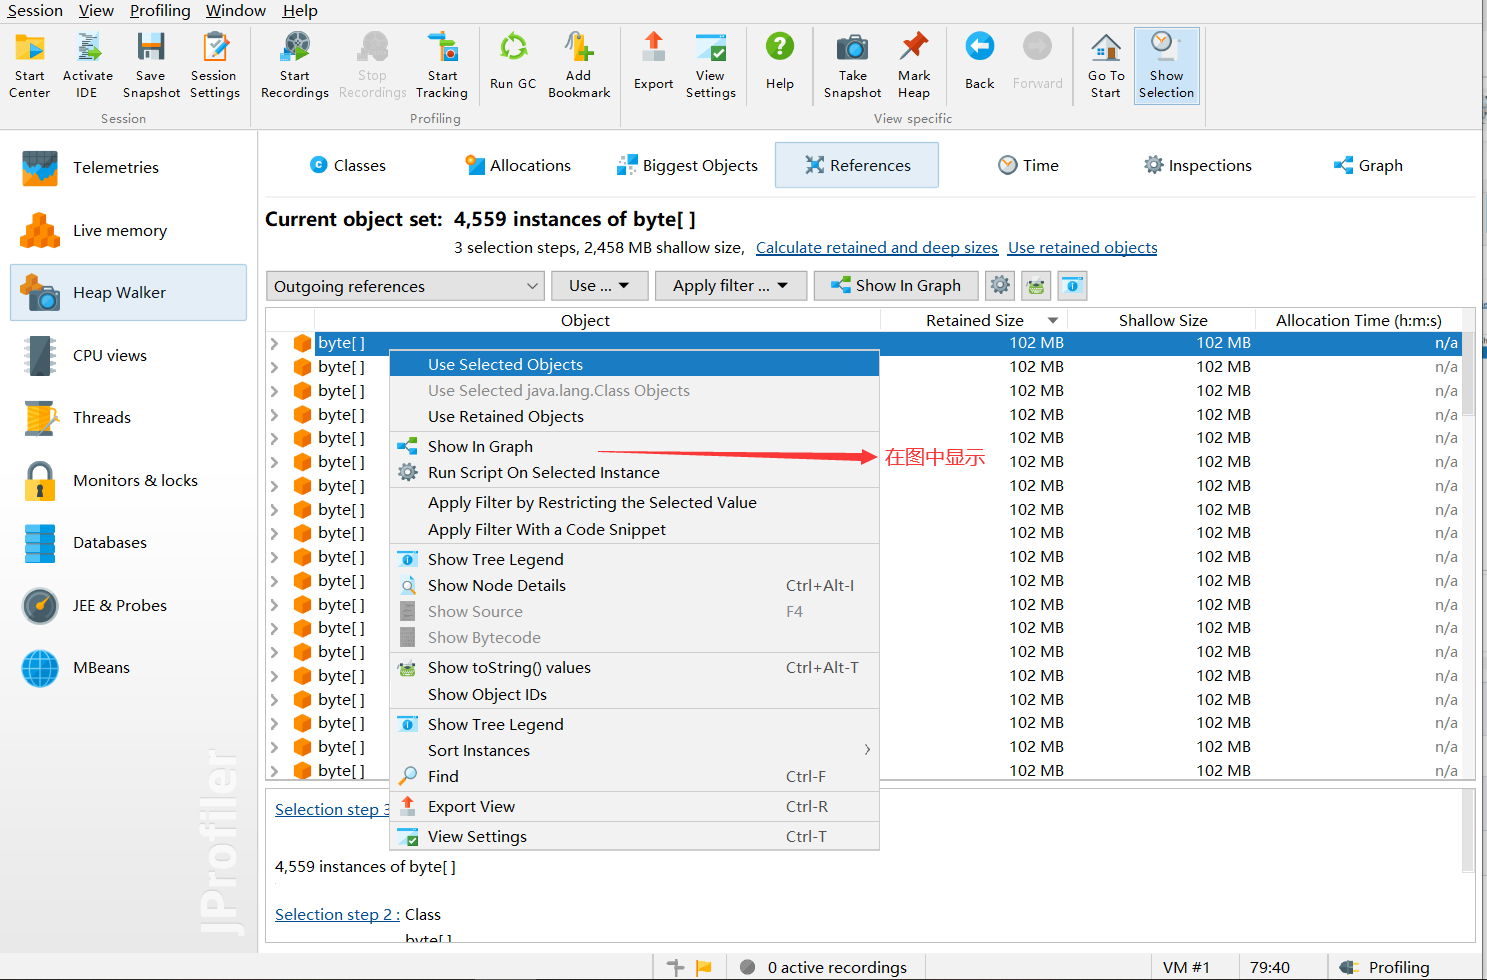
Here's the key - use the selected object:
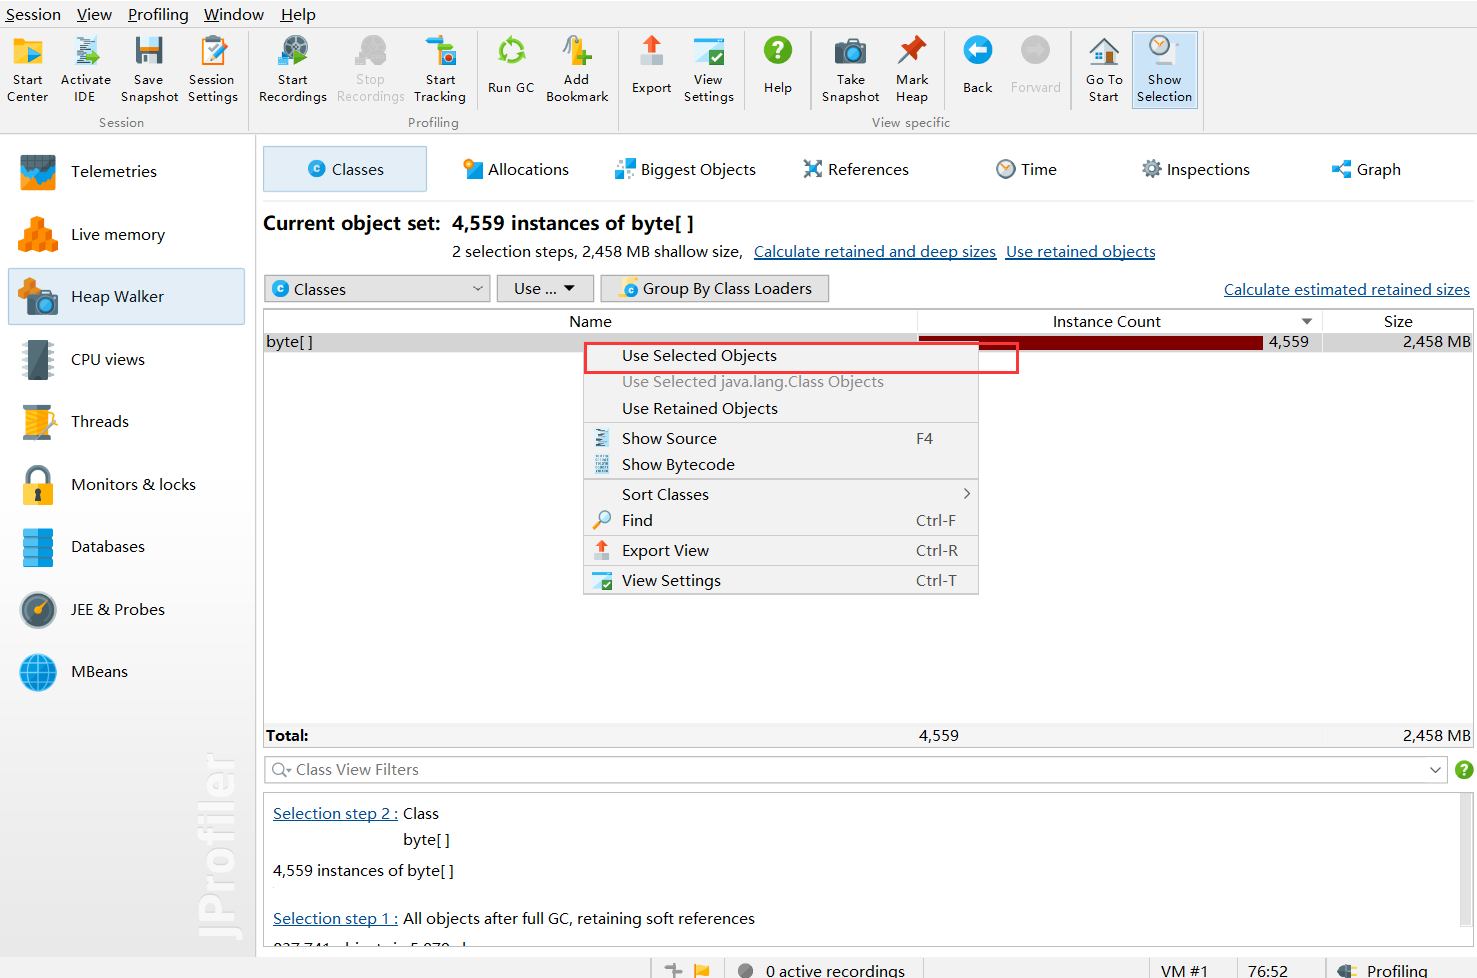
- outgoing: objects produced by the selected object
- incoming: what produced these objects - this is what we want
Enter the interface:
Then select one:
Enter the interface:
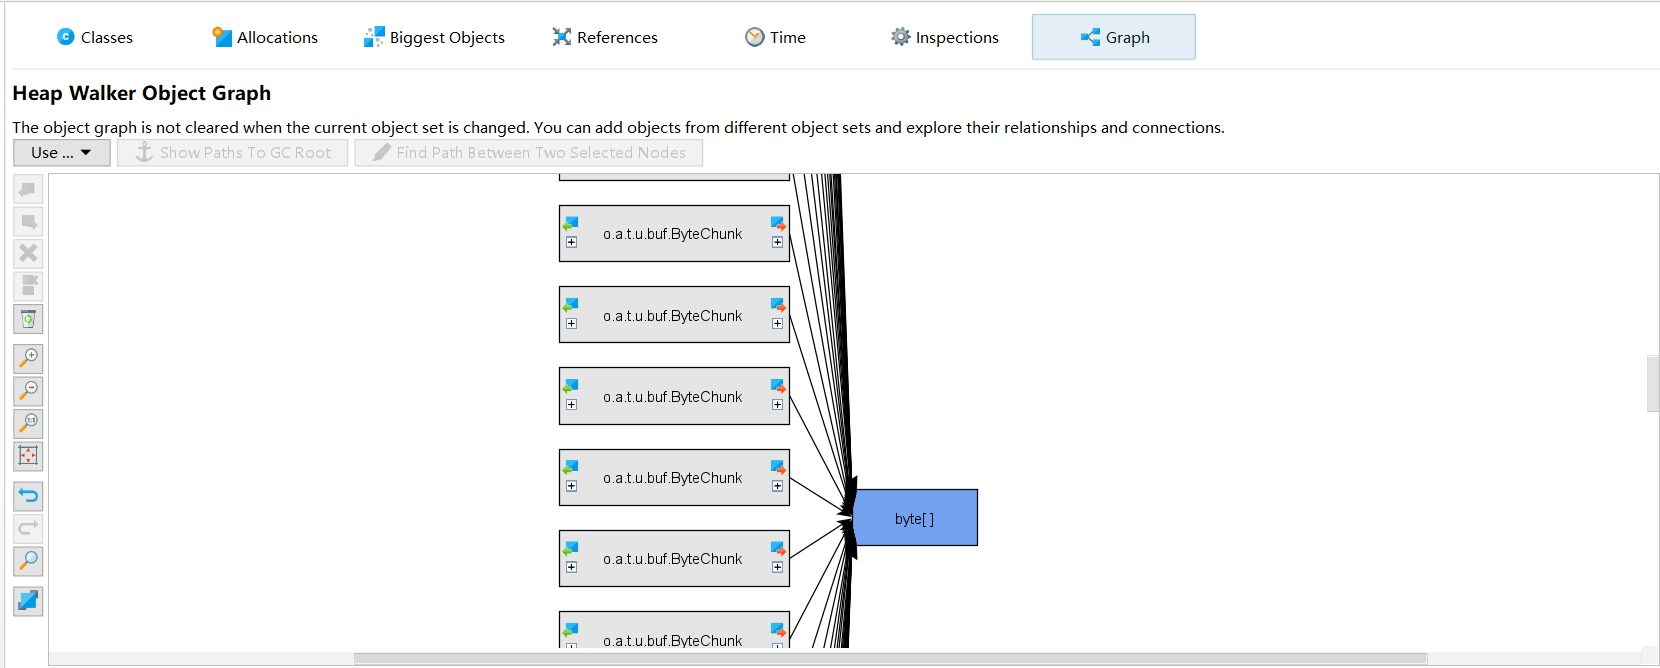
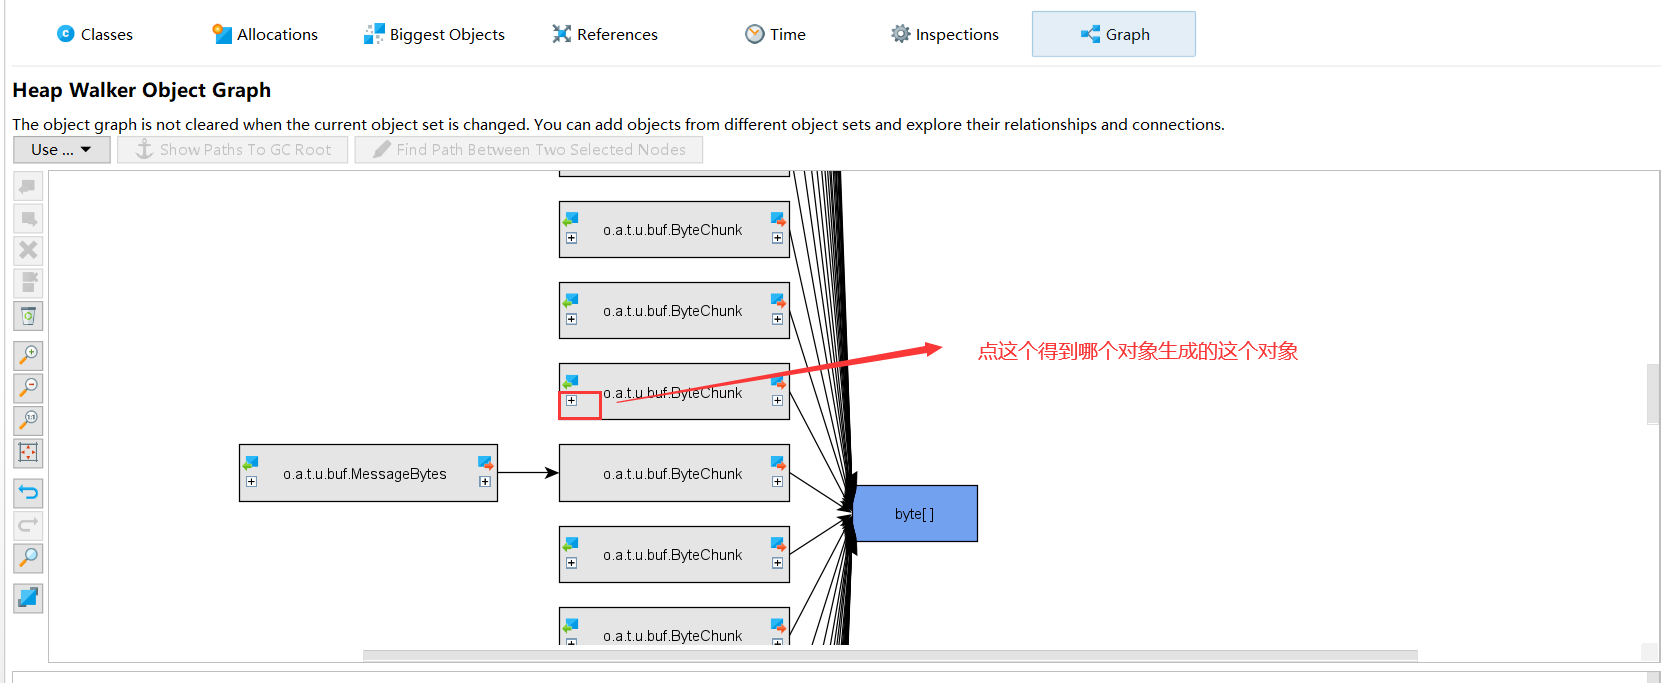
Then I discovered something important:
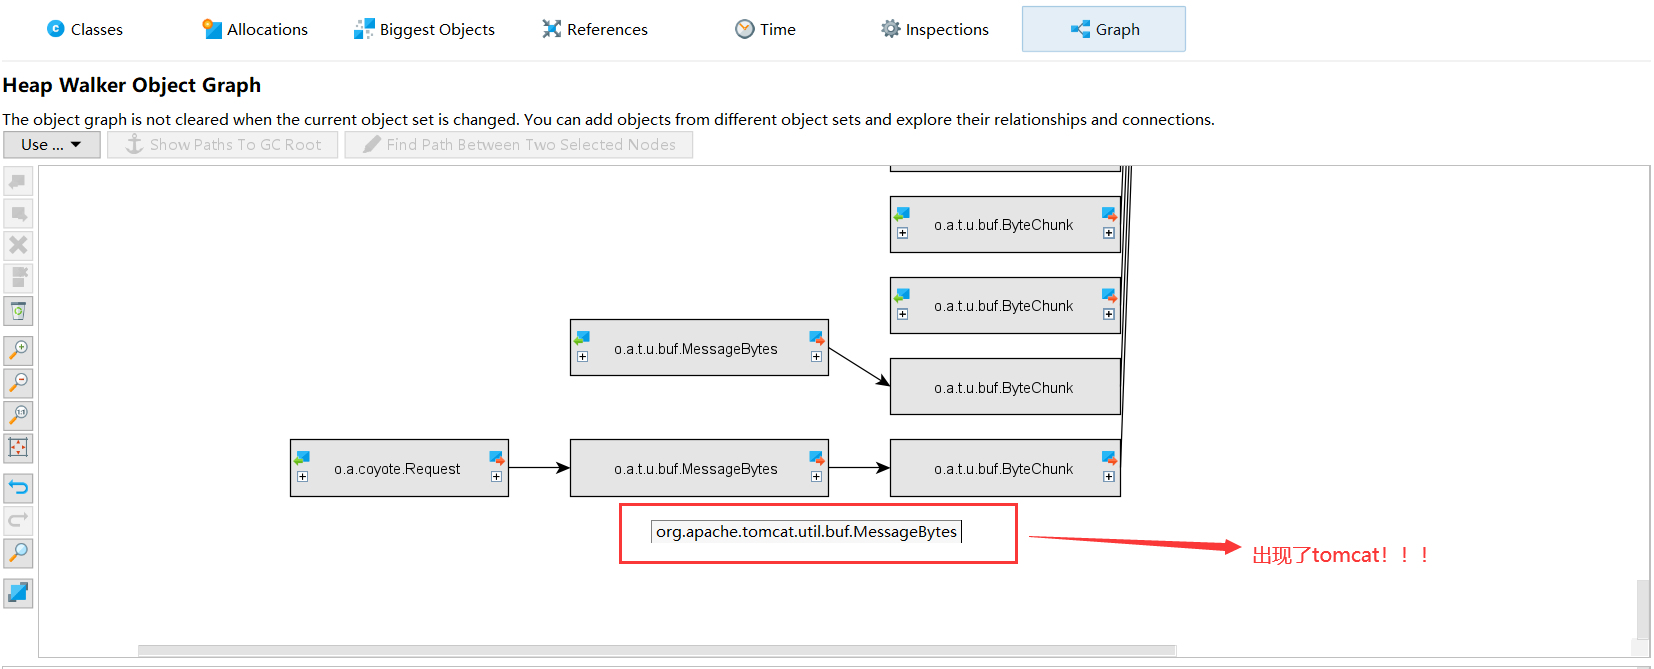
What? It's produced by Tomcat! messageBytes - based on my understanding of Netty, this refers to the inbound handler's message decoding operation.
Case Solved
I checked other byte[] arrays and they were all the same. Could Tomcat be the culprit?? But?!
A flash of insight - I remembered Tomcat configuration options. Something must be misconfigured.
Remove All Tomcat Configuration Options
Restarted and monitored:
Not solved. But byte[] clearly pointed to Tomcat - did I get it wrong?
Let me think about messageBytes again - it means requests. When a request comes in, it causes memory increase. How would Netty handle this?
!!! Got it - remove all request configurations!!!
For example:
server:
  port: 82
  max-http-header-size: 102400000

spring:
  http:
    multipart:
      max-file-size: 100MB
      max-request-size: 10MB

servlet:
     multipart:
       max-file-size:  10MB
       max-request-size:  20MB
Restarted, made requests, monitored:
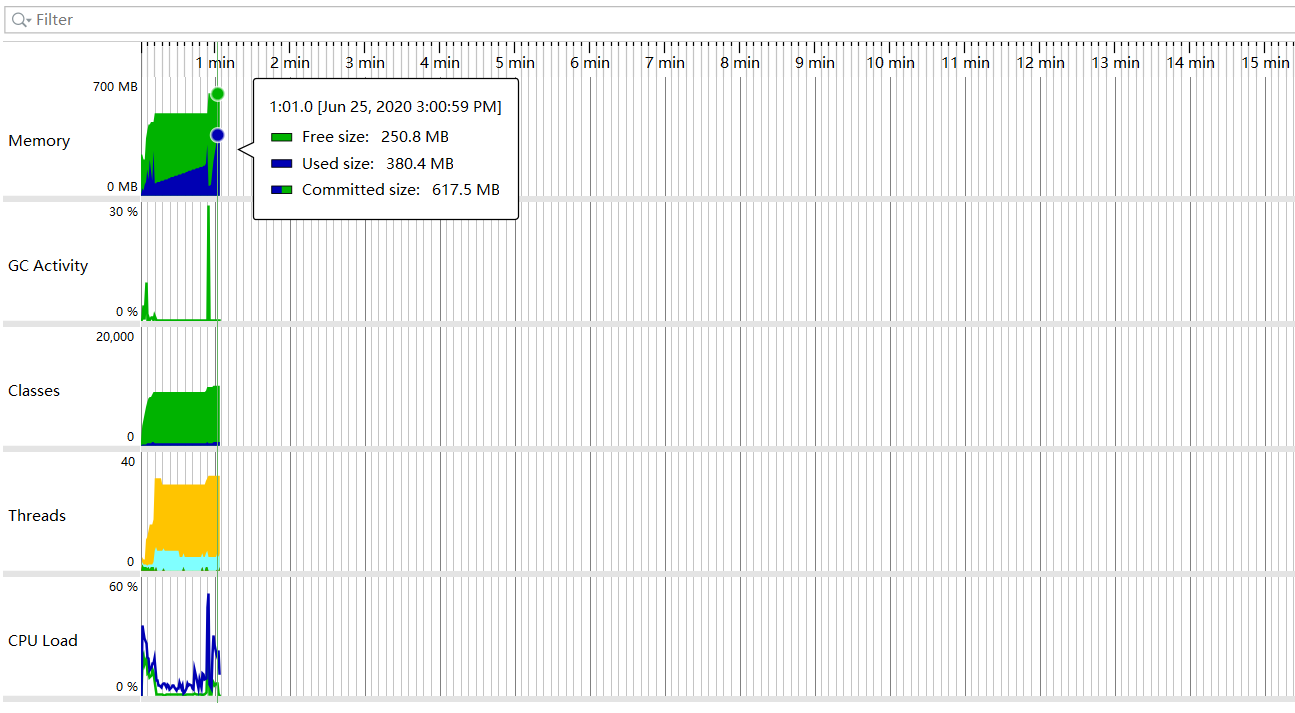
Perfect! Indeed, some parameter configuration was problematic. Now I just need to find which one - at most 5 tries. Got lucky - first try hit it:
max-http-header-size: 102400000
This configuration was the problem. Searched online for what this parameter does:
Sure enough, I wasn't the only one who got burned.
Checked the git commit history, found the colleague who added this parameter and asked why - that's another story involving specific business scenarios. Case closed.
Summary
When copying parameters from online sources, it's best to understand what they mean. This way you'll know why you're using them and can optimize code for your business scenarios. Every small optimization adds up to big improvements - expecting to boost performance 20-30% by adjusting 2-3 parameters is unrealistic, even Elasticsearch can't do that.
Understanding the underlying code also helps us find problems faster instead of guessing blindly. When this issue first appeared, I kept thinking it was caused by ehcache. After all, programs are dead - it's people who truly solve problems.