Part 3: Hands-on - SpringBoot and Elasticsearch Integration with WebFlux Reactive Programming
Part 3: Using Filebeat to Parse Your SpringBoot Logs to Elasticsearch
1. Preface
This is the final part - using Filebeat to parse your SpringBoot logs to Elasticsearch and analyze them in Kibana.
You can find the previous two sections at the links above.
You might ask, why not use Logstash?
Indeed, both Filebeat and Logstash are tools in the Elastic Stack for collecting, parsing, and sending log data. But for individual developers, Filebeat is much more lightweight than Logstash, and configuration is simpler - just one yml config to specify log files, then pull up a Docker container and you're done. As for log data analysis, I don't have the energy to tinker with that yet. The requirement is just to sync logs from different servers to one ES, making it convenient to view logs from different servers, applications, and APIs in Kibana at once, rather than SSH connecting to each one, cd to the specified directory, and waiting for the less command to scroll for a while to reach the latest logs.
2. Filebeat Introduction
First, here's the official Filebeat documentation - the source of most information: Filebeat Reference
Filebeat is a lightweight, efficient tool. Filebeat's main goal is to collect log data from various sources (like log files, system logs, application output, etc.) and transmit it to target storage or processing systems like Elasticsearch or Logstash.
Yes, Filebeat can also work with Logstash, so adding Logstash later for upgrades is fine.
3. Using Filebeat
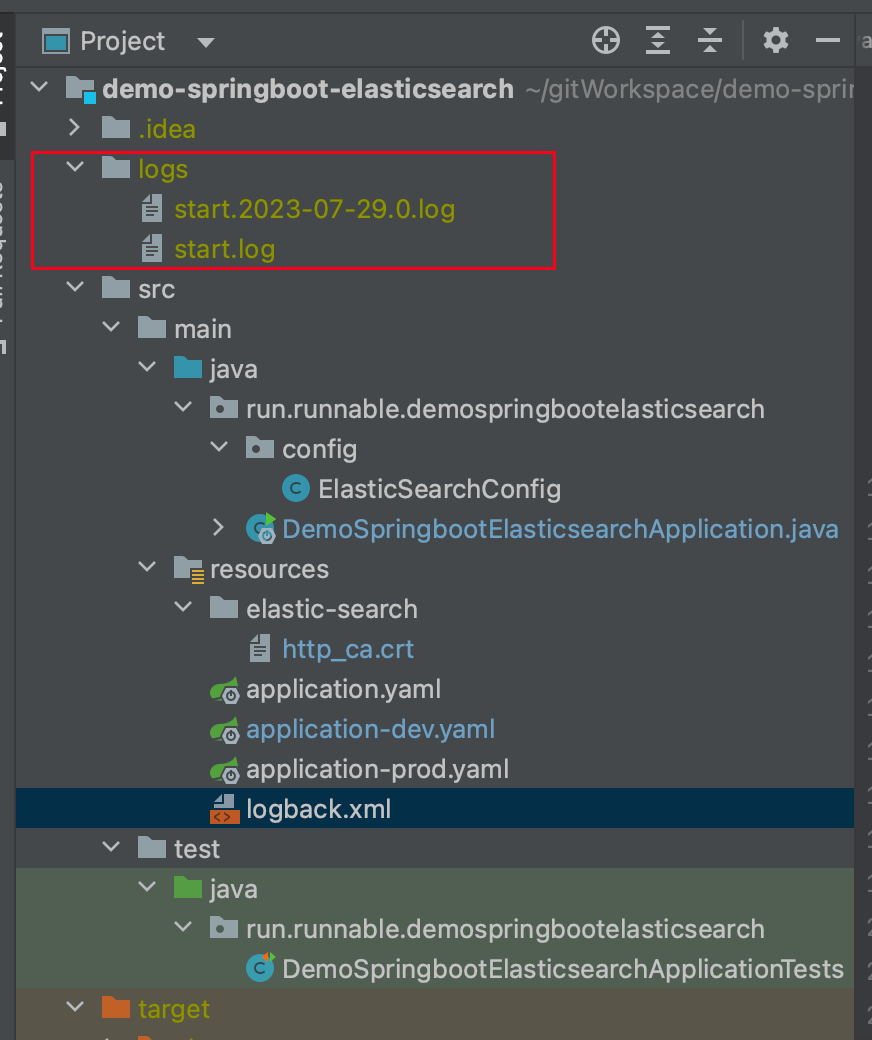
Before using it, the first thing we need to do is find the log location. If you've been following the previous two blog posts, in the project demo-springboot-elasticsearch, the log generation path is configured in logback.xml:
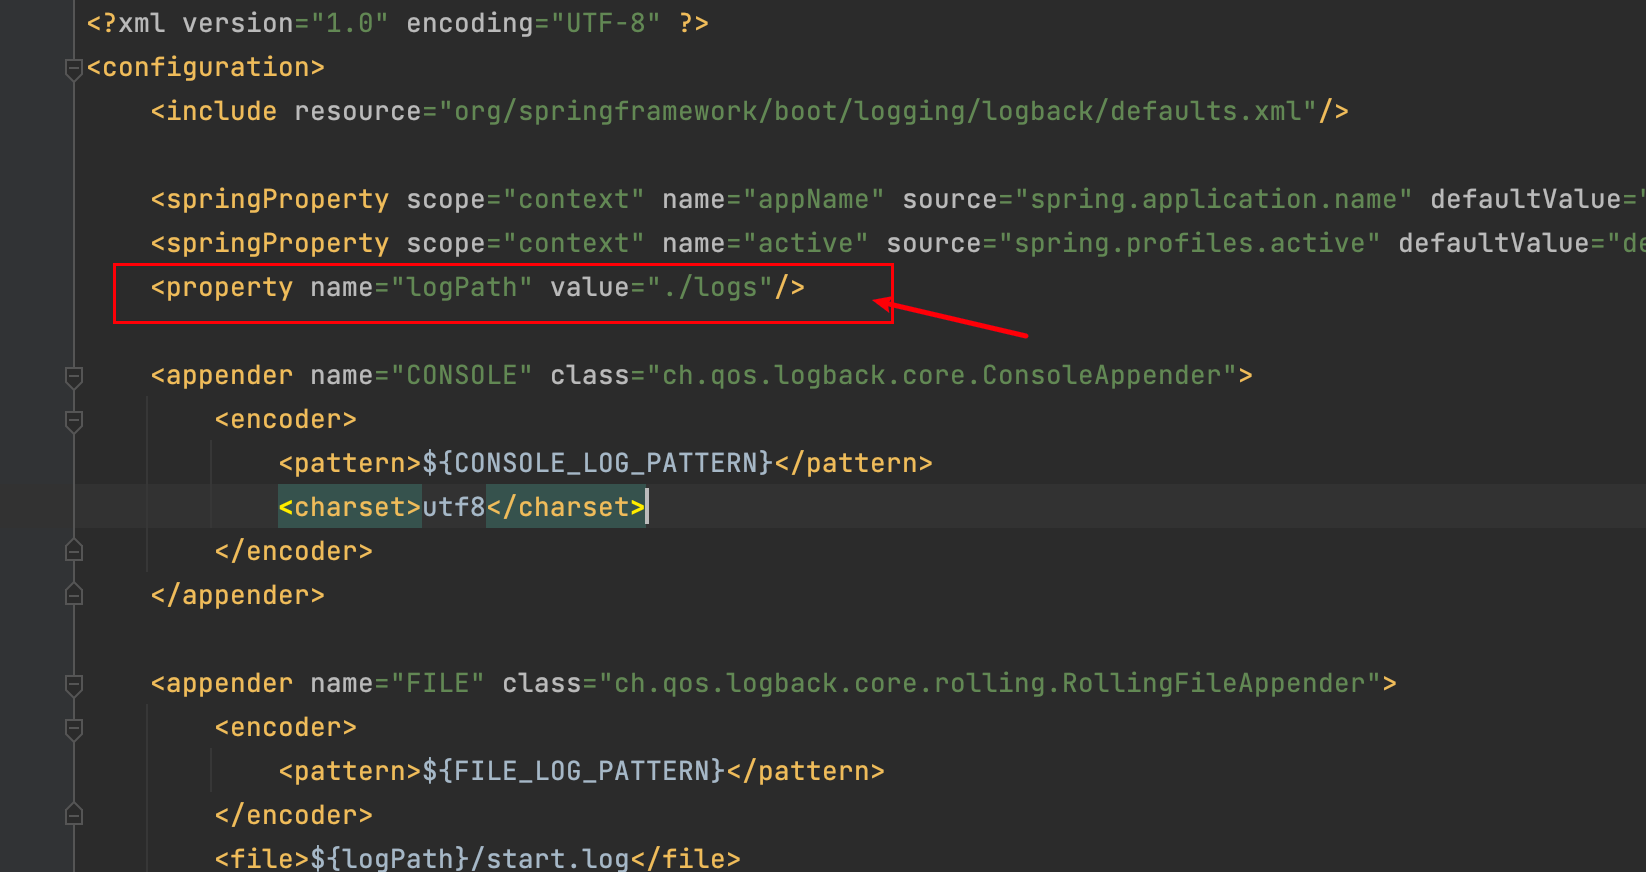
By default, it generates in the current project directory, so you need to note the absolute path of the log directory - we'll use it later.
3.1 Prepare http_ca.crt and filebeat.yml Configuration File
Now that we know the log path, we can start preparing to install Filebeat. We'll still use Docker deployment.
http_ca.crt - do you remember? In newer versions of ES, this is needed to establish SSL connections, and it's needed here too. You can copy another one from the ES container - the following command copies http_ca.crt directly to the current directory:
docker cp elasticsearch:/usr/share/elasticsearch/config/certs/http_ca.crt .
Next, download a filebeat.yml template file:
curl -L -O https://raw.githubusercontent.com/elastic/beats/8.9/deploy/docker/filebeat.docker.yml
For those with slow downloads, you can use the content below directly - it's the same:
filebeat.config:
  modules:
    path: ${path.config}/modules.d/*.yml
    reload.enabled: false

filebeat.autodiscover:
  providers:
    - type: docker
      hints.enabled: true

processors:
- add_cloud_metadata: ~

output.elasticsearch:
  hosts: '${ELASTICSEARCH_HOSTS:elasticsearch:9200}'
  username: '${ELASTICSEARCH_USERNAME:}'
  password: '${ELASTICSEARCH_PASSWORD:}'
Then modify this template file according to your environment:
# Don't change this - filebeat has built-in modules to help parse logs like nginx
# Here we don't parse SpringBoot logs through this
filebeat.config:
  modules:
    path: ${path.config}/modules.d/*.yml
    reload.enabled: false

# Log file input source to filebeat
filebeat.inputs:
- type: filestream
  enabled: true
  id: demo-springboot-elasticsearch
  paths:
    - /share/Develop/dockerData/runnable-run/demo-springboot-elasticsearch/logs/*.log
  pipeline: springboot_pipeline
  tags: ["demo-springboot-elasticsearch"]

processors:
  - add_cloud_metadata: ~

# Filebeat output configuration - your ES configuration
output.elasticsearch:
  hosts: ['https://ip:9200']
  username: 'elastic'
  password: 'password'
  ssl:
    enabled: true
# http_ca.crt
    certificate_authorities: "/usr/share/filebeat/http_ca.crt"
  setup.kibana:
    host: "ip:5601"
    username: "elastic"
    password: "password"
  indices:
    - index: "demo-springboot-elasticsearch"
      when.contains:
        tags: "demo-springboot-elasticsearch"
Configuration explanations:
type: filestream- There are many types, but here we need filebeat to read .log files, so filestream is sufficientid: demo-springboot-elasticsearch: Specify a unique ID to identify this input configurationpaths: Specify the log file paths to monitor/share/Develop/dockerData/runnable-run/demo-springboot-elasticsearch/logs/*.log: Uses wildcard*to match all .log files in the specified directory. Filebeat will monitor log data in these files.
pipeline: springboot_pipeline- This tells ES whichpipelineto use to parse logs after they're pushed to ES. We'll cover this shortly.tags: ["demo-springboot-elasticsearch"]- Adds a tag to all log events collected from this input source. This tag helps identify specific log data sources in subsequent processing.output.elasticsearch: This section specifies the configuration for Filebeat to send log data to Elasticsearch.hosts: ['https://ip:9200']: Specify the Elasticsearch cluster host address and port. Using https protocol for secure connection.username: 'elastic': Username for connecting to Elasticsearch.password: 'password': Password for connecting to Elasticsearch.ssl.enabled: true: Enable SSL/TLS secure connection to ensure data transmission security.certificate_authorities: "/usr/share/filebeat/http_ca.crt": Specify the CA certificate file path for verifying the connection with Elasticsearch. We'll mount this certificate via Docker, so the path can stay the same.setup.kibana: This section configures the connection between Filebeat and Kibana.host: "ip:5601": Specify Kibana's host address and port.username: "elastic": Username for connecting to Kibana.password: "password": Password for connecting to Kibana.indices: This section specifies index configuration when writing log data to Elasticsearch.index: "demo-springboot-elasticsearch": Specify index name as "demo-springboot-elasticsearch". Filebeat will write collected log data to this index.when.contains: A conditional check - when log events contain the specific tag "demo-springboot-elasticsearch", write them to the specified index above.
Someone has already compiled many filebeat templates - see this blog post: filebeat custom index name, filebeat index template
After configuration, don't rush - we're not at the container startup step yet. First go to Kibana to configure the springboot_pipeline mentioned in the filebeat.yml file. This springboot_pipeline tells ES how to parse your logs - you can't just throw logs up there and ignore them.
3.2 Create Pipeline to Parse SpringBoot Logs
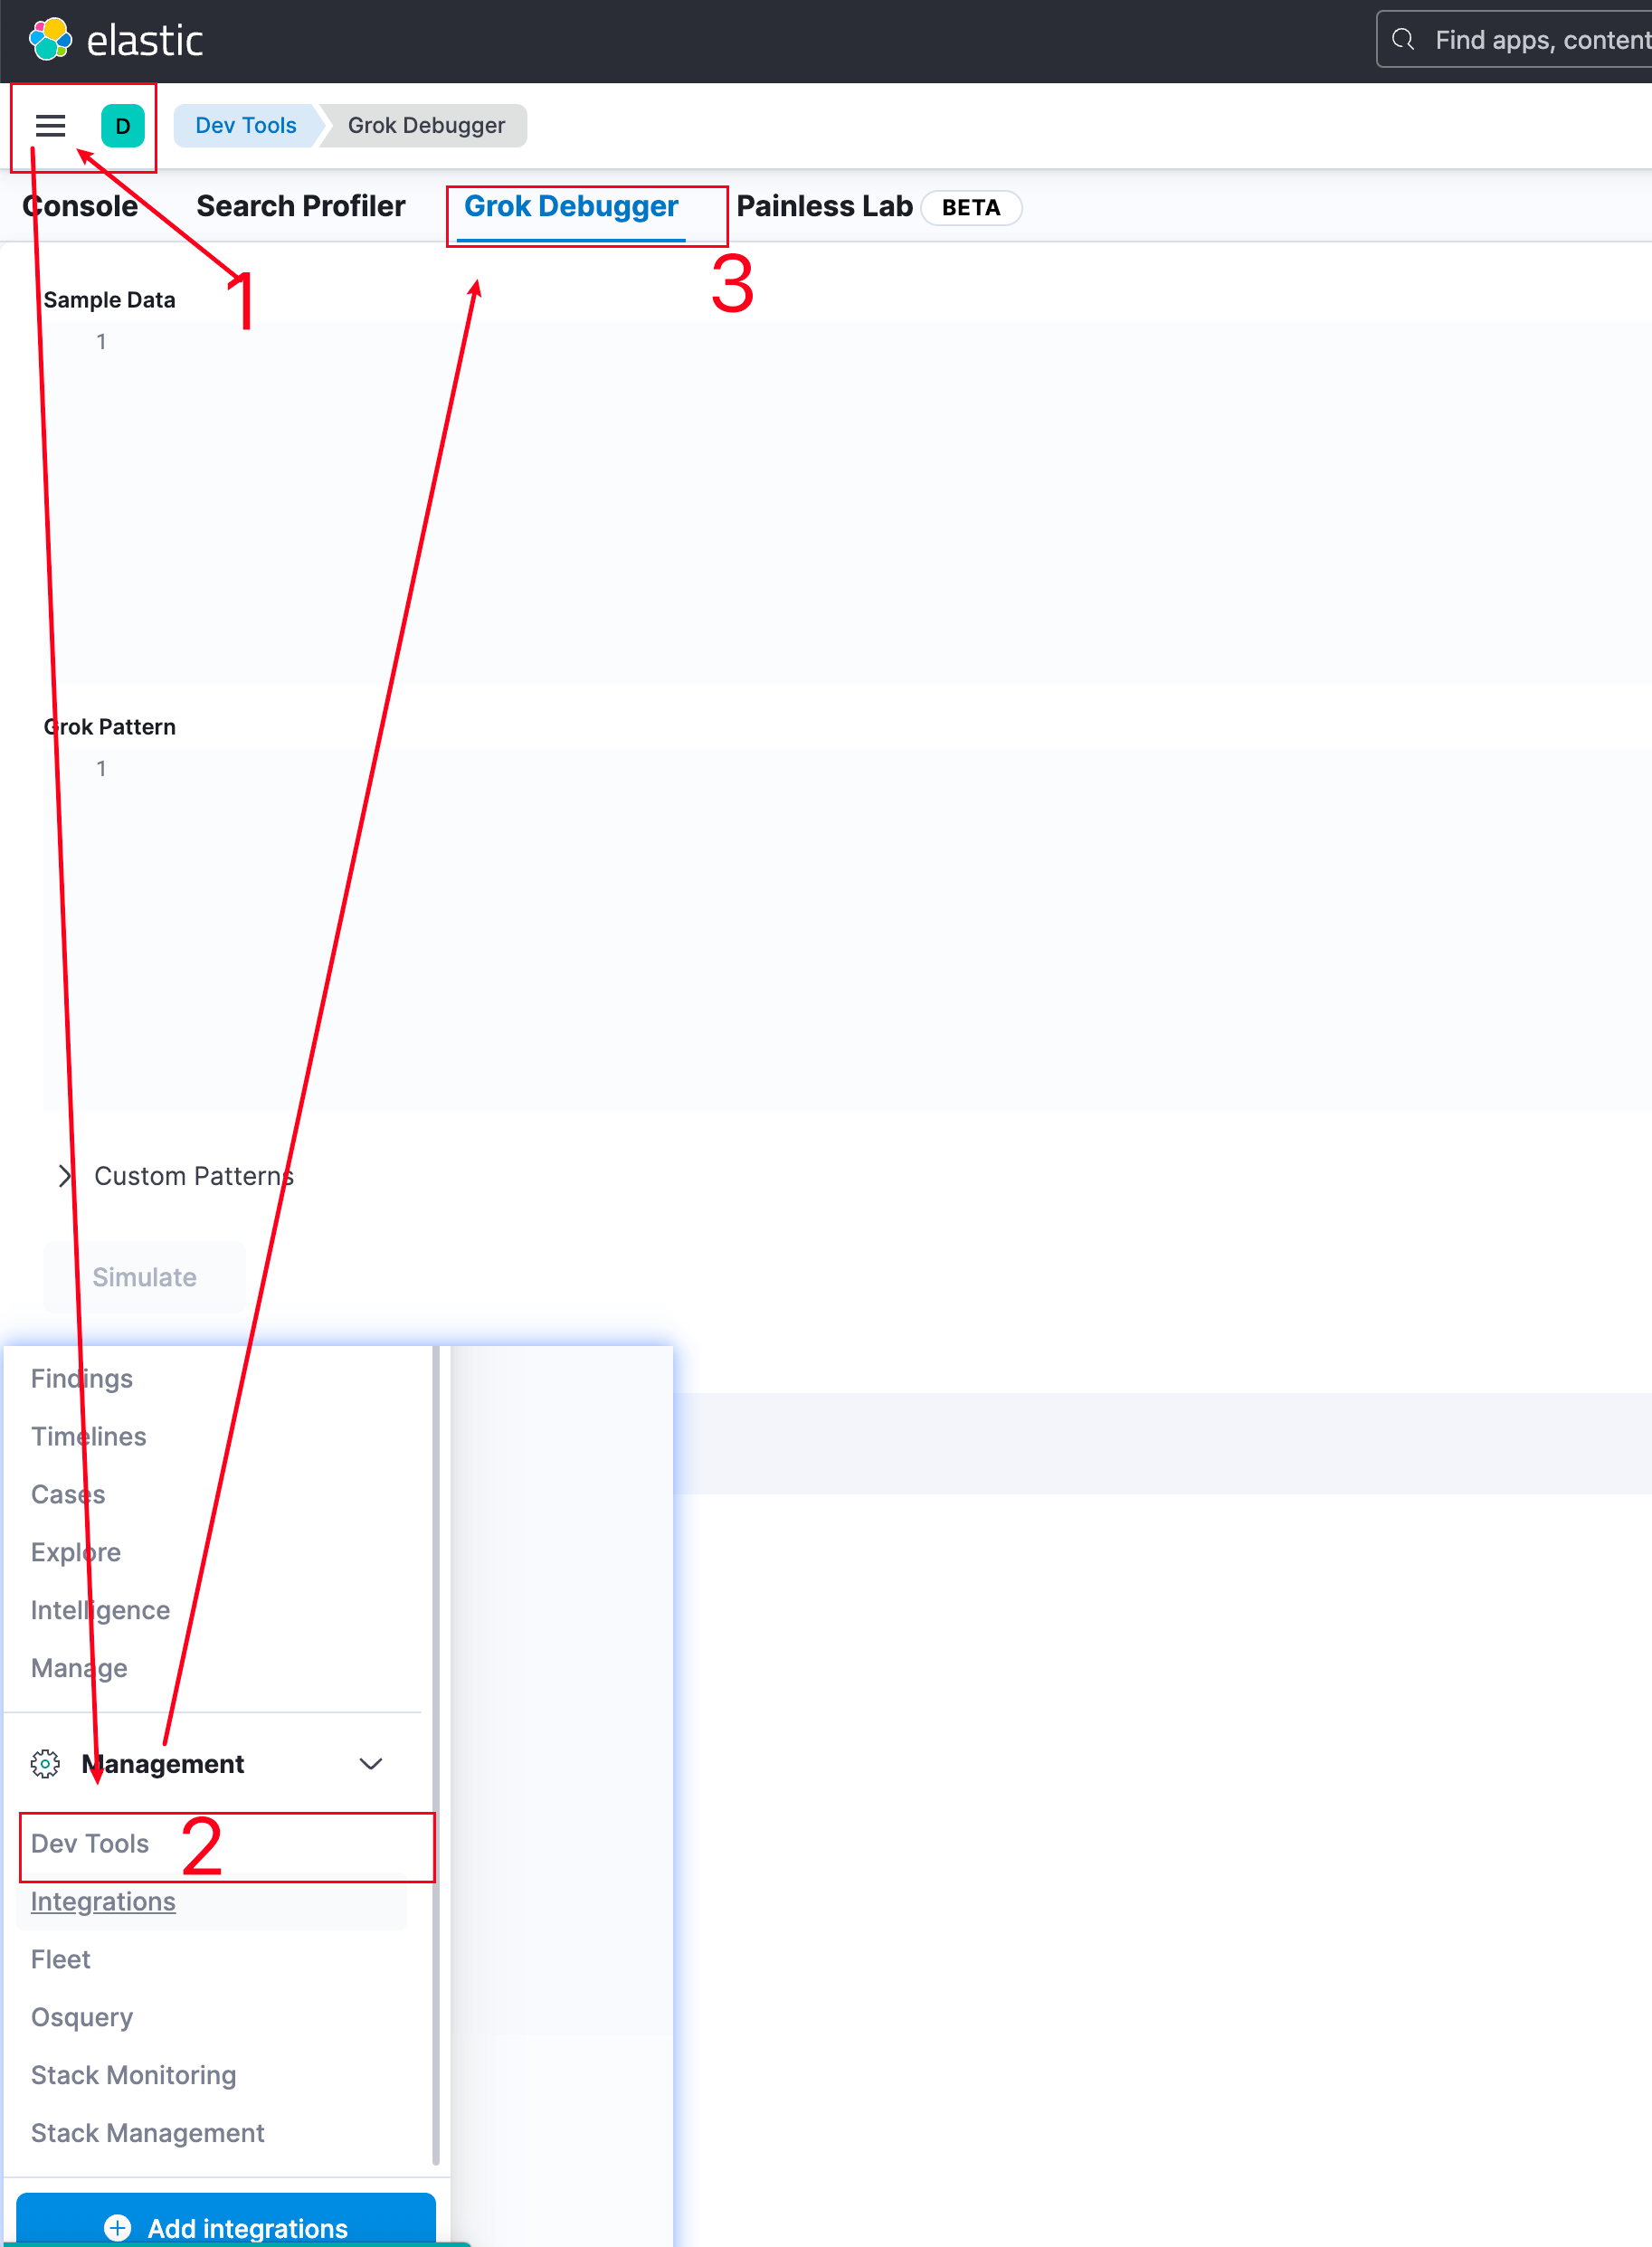
Log into Kibana. We can first write the syntax for parsing SpringBoot logs in Dev Tools.
Of course, you can skip this part and use what I've already written. This section tells you how to troubleshoot if logs are pushed to ES but you can't find the corresponding index, or the index has no data - you need to check if your pipeline parsing is correct.
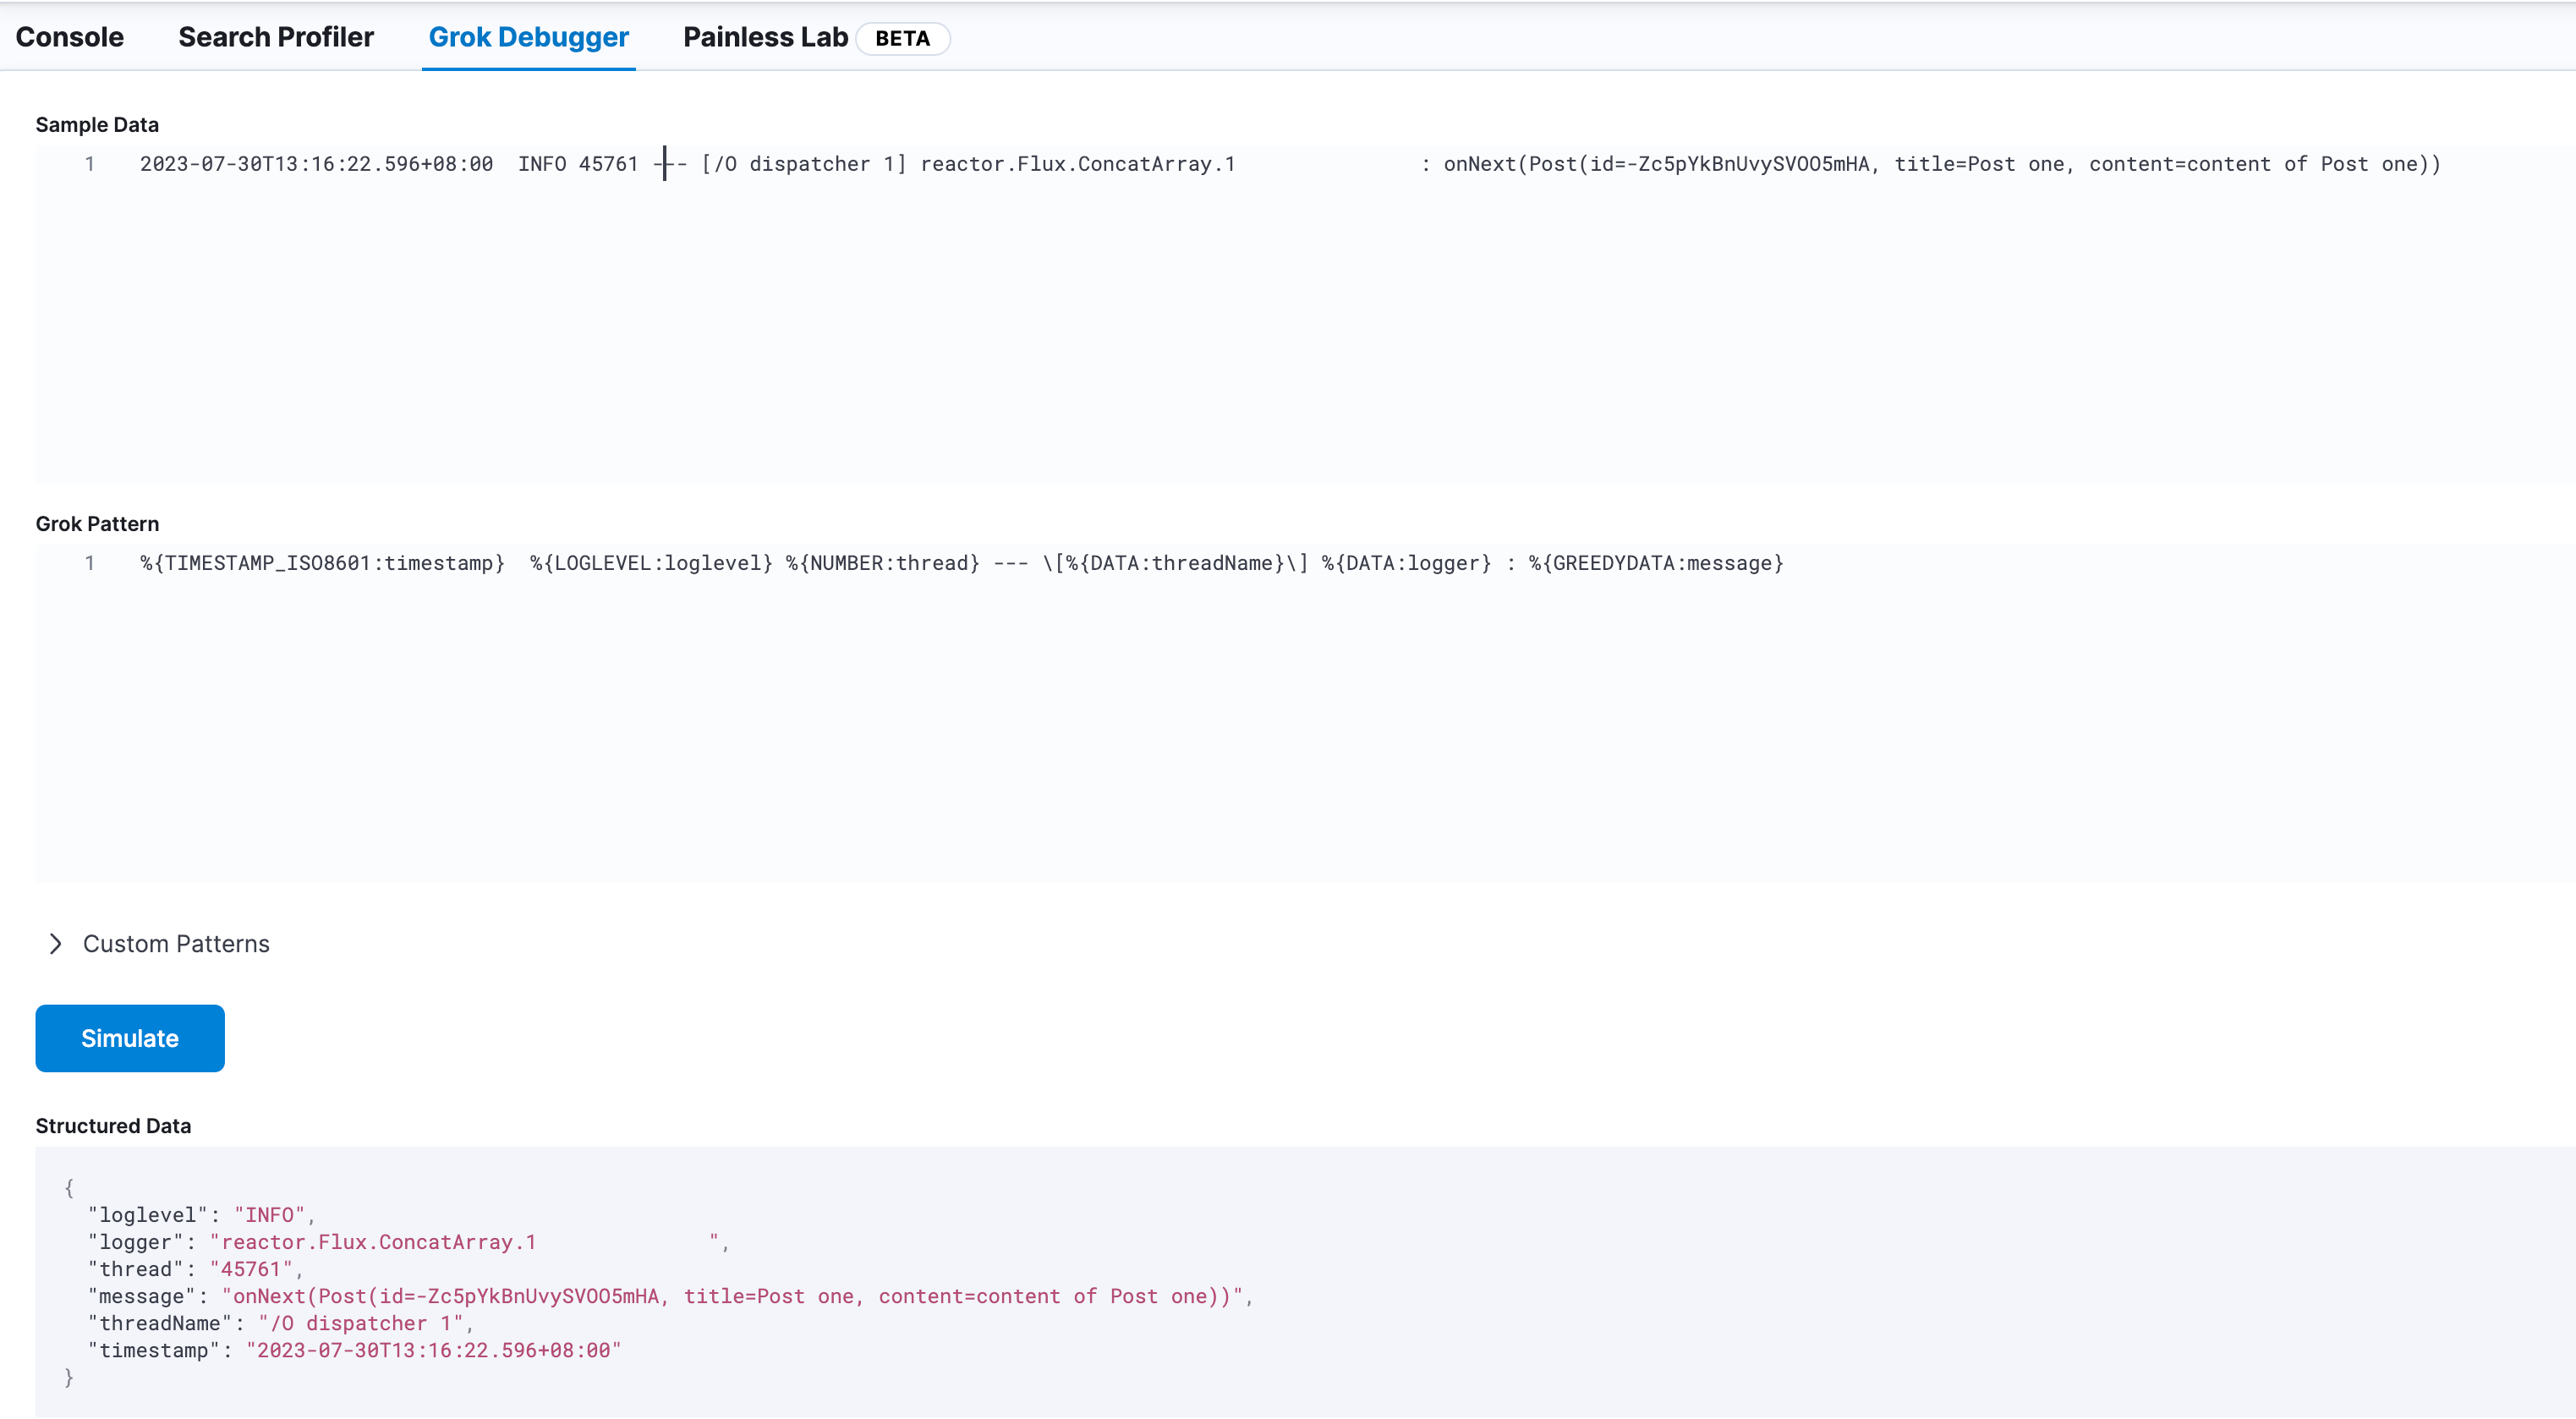
Fill in some SpringBoot log samples in Sample Data. I know some people use custom log formats:
Then write matching syntax in the Grok Pattern below. ES has a page explaining how to use Grok Pattern: https://www.elastic.co/guide/en/logstash/current/plugins-filters-grok.html
Here's what I use:
%{TIMESTAMP_ISO8601:timestamp} %{LOGLEVEL:loglevel} %{NUMBER:thread} --- \[%{DATA:threadName}\] %{DATA:logger} : %{GREEDYDATA:message}
%{TIMESTAMP_ISO8601:timestamp} - % represents a parsing expression, TIMESTAMP_ISO8601 is the matching rule, timestamp is the field name that will be generated.
Then click Simulate below. If matched correctly, the parsed fields will be displayed. If there's a problem, an error will appear in the bottom right corner.
Then go back to the Console page, replace patterns with your Grok Pattern that matches logs - you may need to add \ escape characters:
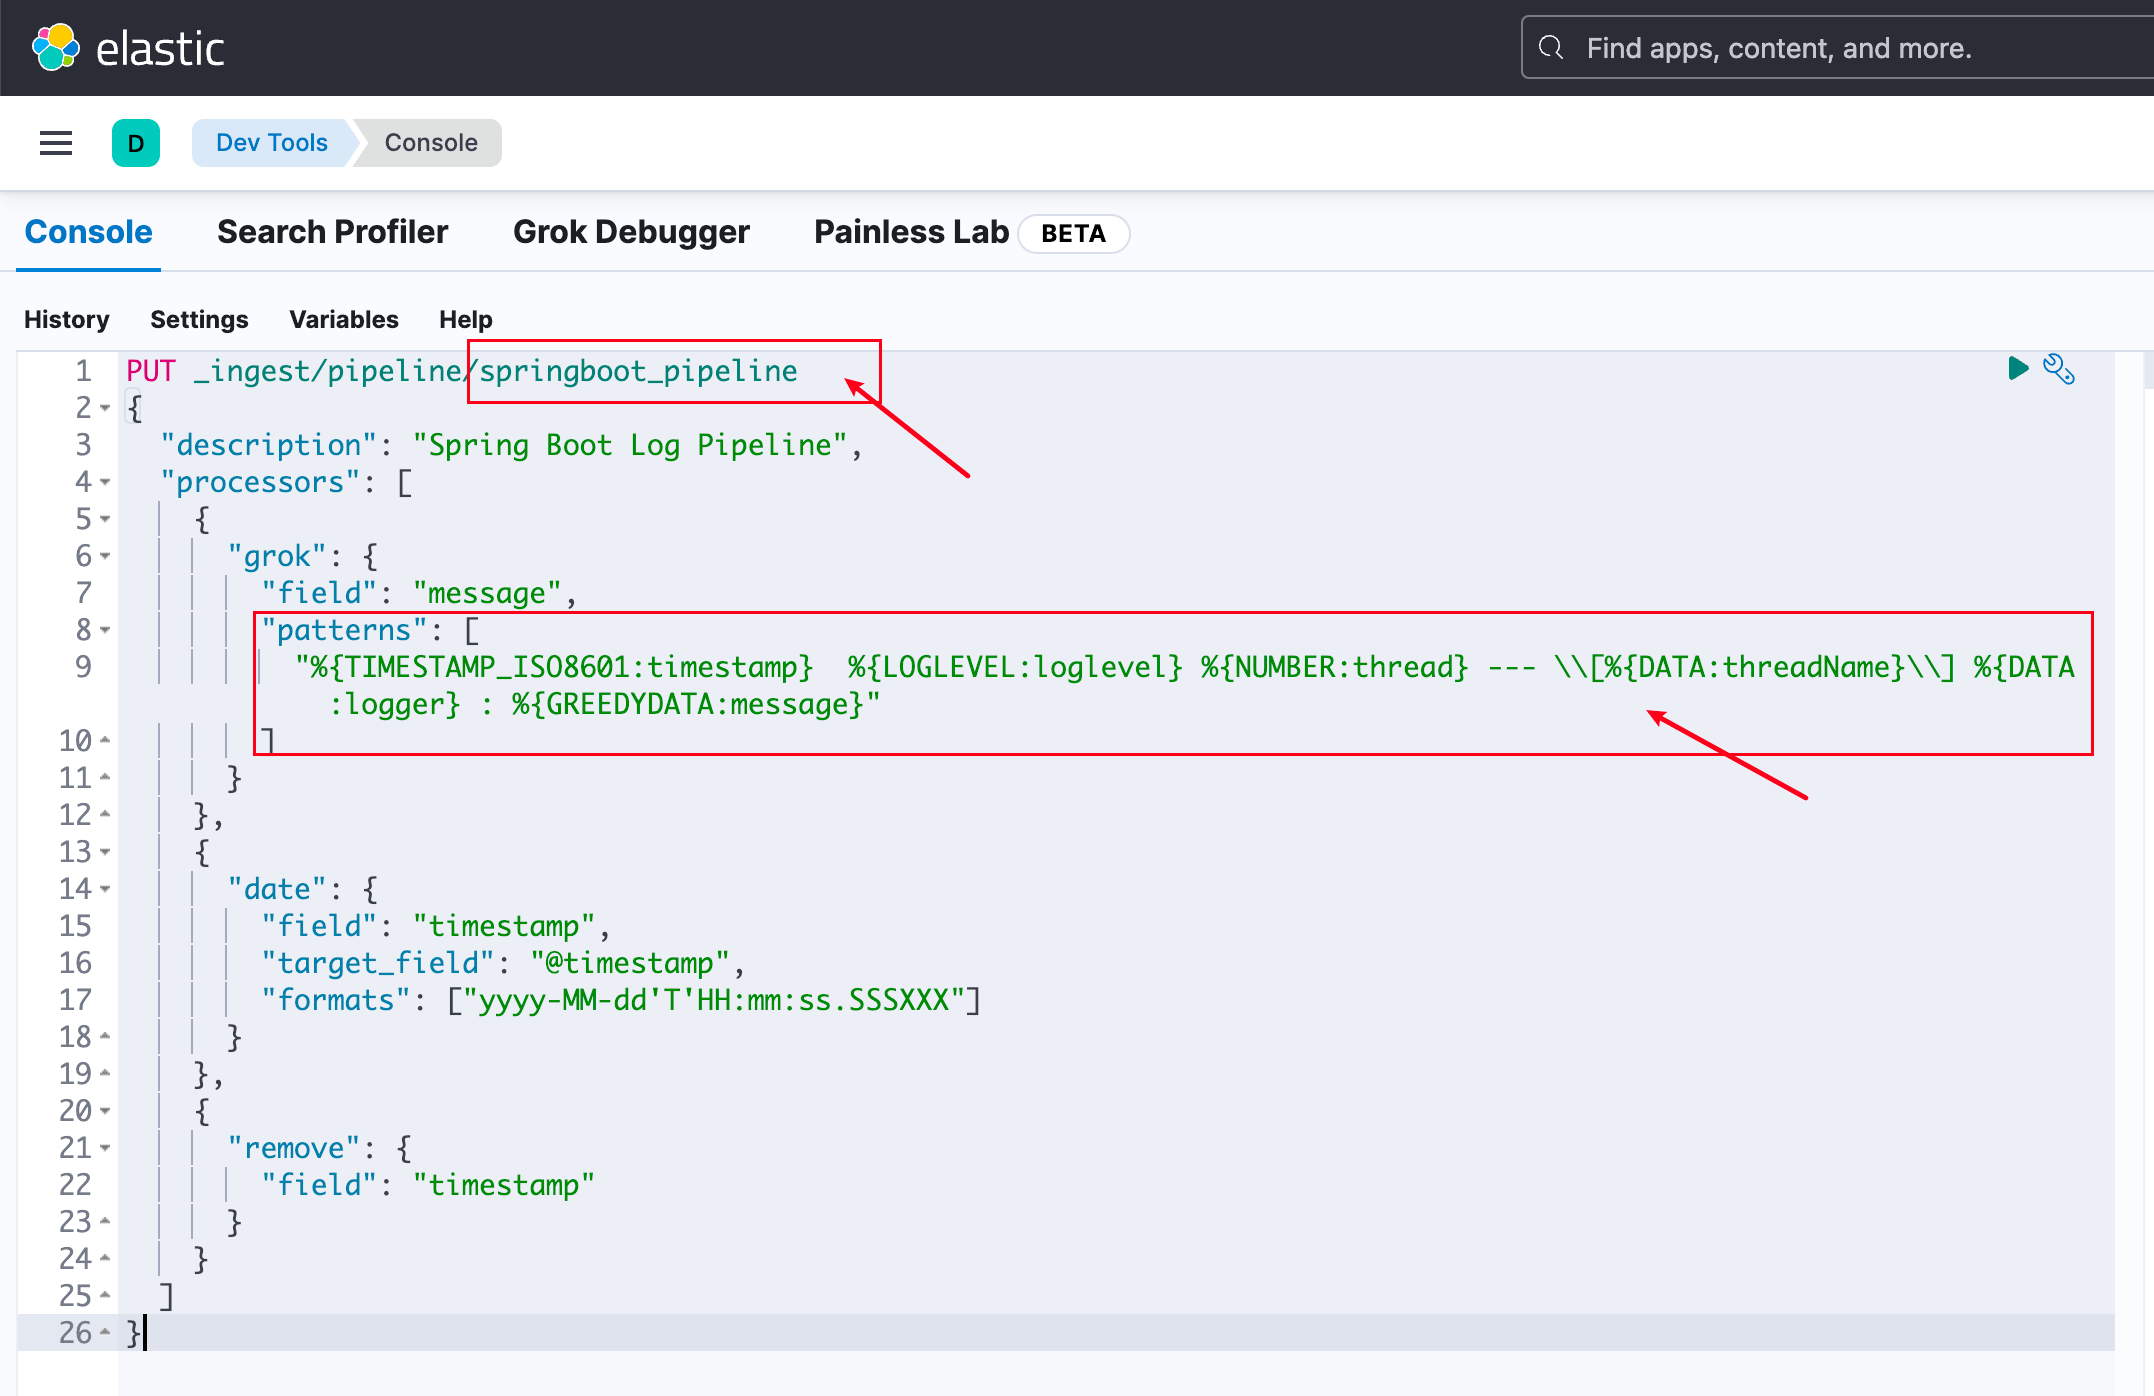
Use the following code to write springboot_pipeline to ES, then click the run button in the top right corner:
PUT _ingest/pipeline/springboot_pipeline
{
  "description": "Spring Boot Log Pipeline",
  "processors": [
    {
      "grok": {
        "field": "message",
        "patterns": [
          "%{TIMESTAMP_ISO8601:timestamp}  %{LOGLEVEL:loglevel} %{NUMBER:thread} --- \\[%{DATA:threadName}\\] %{DATA:logger} : %{GREEDYDATA:message}"
        ]
      }
    },
    {
      "date": {
        "field": "timestamp",
        "target_field": "@timestamp",
        "formats": ["yyyy-MM-dd'T'HH:mm:ss.SSSXXX"]
      }
    },
    {
      "remove": {
        "field": "timestamp"
      }
    }
  ]
}
Note the formats in the command above - if the time format doesn't match, ES won't be able to parse it.
Now your ES has this pipeline. The last step is to run the filebeat container.
2023-11-04 17:57:04 Update
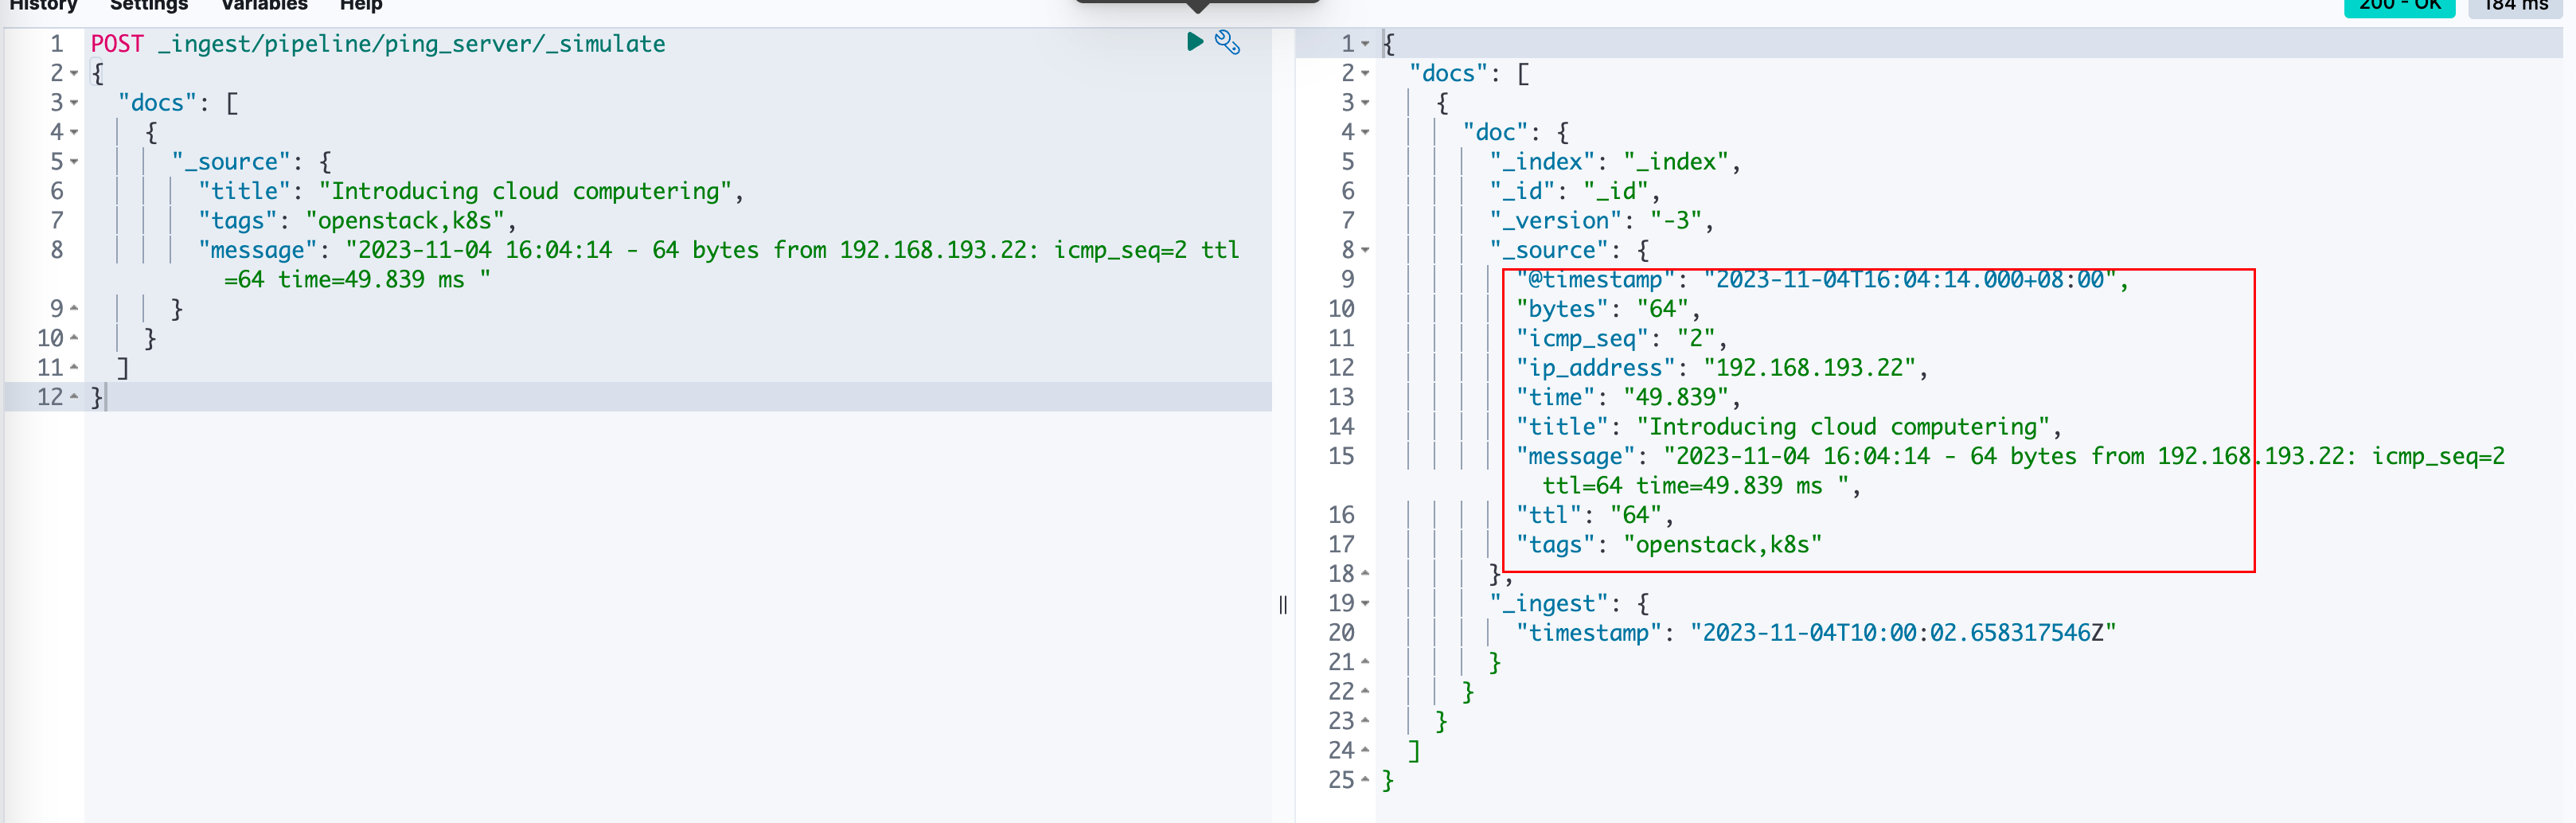
After creating this pipeline, if you want to verify it directly, you can execute the following command in that same window. If there are errors, ES will throw them directly:
POST _ingest/pipeline/ping_server/_simulate
{
  "docs": [
    {
      "_source": {
        "title": "Introducing cloud computing",
        "tags": "openstack,k8s",
        "message": "2023-11-04 16:04:14 - 64 bytes from 192.168.193.22: icmp_seq=2 ttl=64 time=49.839 ms "
      }
    }
  ]
}
When executed normally:
3.3 Start Filebeat with Docker
Go back to your server terminal, enter the directory containing filebeat.yml and http_ca.crt, create a data directory for filebeat data. Otherwise, deleting and recreating the container will cause all logs to be re-pushed to ES - if you have a year's worth of data being re-pushed, you'll want to cry...
mkdir data
I put them in the same folder. Then use the following command to start. You need to change /share/Develop/dockerData/runnable-run/ to your log path:
docker run  \
  --name=filebeat \
  --user=root \
  --volume="$(pwd)/filebeat.yml:/usr/share/filebeat/filebeat.yml:ro" \
  --volume="$(pwd)/http_ca.crt:/usr/share/filebeat/http_ca.crt:ro" \
  --volume="$(pwd)/data/:/usr/share/filebeat/data/" \
  --volume="/share/Develop/dockerData/runnable-run/:/share/Develop/dockerData/runnable-run/:ro" \
  --volume="/var/lib/docker/containers:/var/lib/docker/containers:ro" \
  --volume="/var/run/docker.sock:/var/run/docker.sock:ro" \
  docker.elastic.co/beats/filebeat:8.8.0 filebeat -e --strict.perms=false
--user=root: Run container as root user to ensure Filebeat has sufficient permissions to access required resources and files.--volume="$(pwd)/filebeat.yml:/usr/share/filebeat/filebeat.yml:ro": Mount thefilebeat.ymlconfig file from current directory to/usr/share/filebeat/filebeat.ymlin container, read-only (ro).--volume="$(pwd)/data/:/usr/share/filebeat/data/": Mount filebeat's data directory.--volume="$(pwd)/http_ca.crt:/usr/share/filebeat/http_ca.crt:ro": Mount thehttp_ca.crtcertificate file from current directory to/usr/share/filebeat/http_ca.crtin container, read-only (ro).--volume="/share/Develop/dockerData/runnable-run/:/share/Develop/dockerData/runnable-run/:ro": Mount host's/share/Develop/dockerData/runnable-run/directory to same path in container, read-only (ro).--volume="/var/lib/docker/containers:/var/lib/docker/containers:ro": Mount host's/var/lib/docker/containersdirectory to same path in container, read-only (ro).--volume="/var/run/docker.sock:/var/run/docker.sock:ro": Mount host's Docker daemon Unix socket to/var/run/docker.sockin container, read-only (ro). This allows Filebeat to communicate with Docker daemon to get Docker container info and logs.docker.elastic.co/beats/filebeat:8.8.0: Specify the Filebeat container image name and version.filebeat -e --strict.perms=false: Command to run when starting Filebeat container:filebeat: Execute Filebeat program.-e: Run Filebeat in debug mode, output logs to console.--strict.perms=false: Disable strict permission checking on config files for compatibility with certain container environments, ensuring Filebeat can read config and other files.
I didn't set -d so you can see logs being read by filebeat and pushed to ES on first startup.
If everything is normal, you'll see SpringBoot log content in the output, and in Kibana you'll see the index correctly created with corresponding data:
4. Troubleshooting
If filebeat starts but doesn't push logs to ES, check these:
- Is the log directory correctly mounted to filebeat?
- filebeat.yaml file configuration
- Is
springboot_pipelineparsing correctly?
Also use Dev Tools to directly test if your grok pattern is correct.
5. Extended Section
After completing the above, you can essentially throw any logs at ES for parsing - as long as they have formatted output, just write your own Grok Pattern.
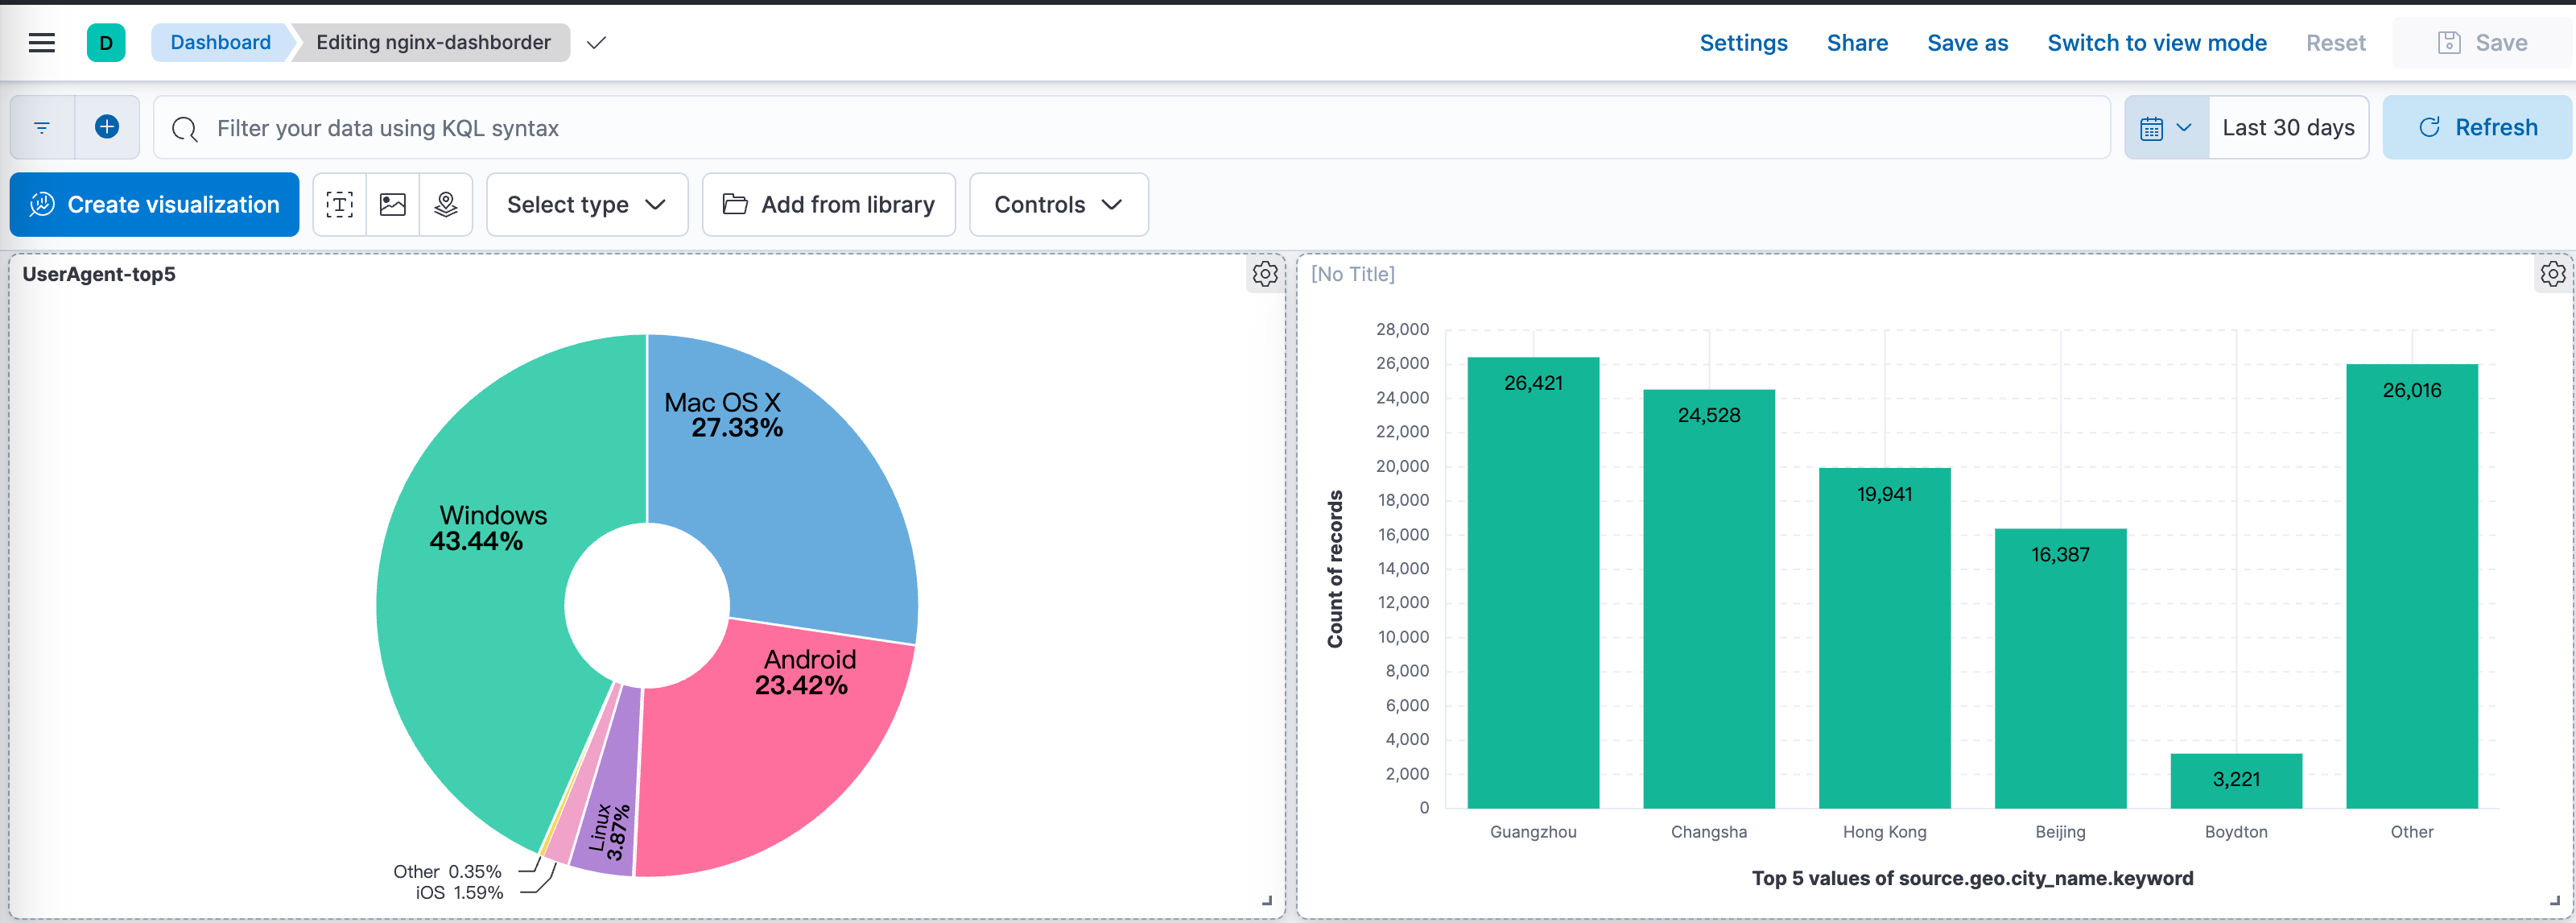
So other containers on the server that can output logs, along with API-generated logs I wrote before, all go up there. Then the fun begins - in ES's dashboard, create statistics for corresponding properties and you have a simple monitoring dashboard. For example, putting nginx logs up there lets you directly see blog IP request statistics.
This part requires you to explore how to play with it yourself.
For example, after putting nginx logs up there, I discovered that in the past month, the most visits to my blog came from the Changsha area, and there are quite a few Android devices too.
References
Using Filebeat to Collect Docker Container Logs
Metricbeat: Certificate signed by unknown authority
input logs an error when an existing input is reloaded with the same ID
Parsing logback log files with filebeat and sending them to Elasticsearch