[Part 1] Hands-On: Perfect Integration of SpringBoot and ElasticSearch with WebFlux Reactive Programming
[Part 1] Installing the Latest Elasticsearch (8.8.0) and Kibana (8.8.0)
1. Introduction
This article covers:
- Installing the latest Elasticsearch (8.8.0) and Kibana (8.8.0)
- SpringBoot integration with Elasticsearch CRUD and WebFlux for fully reactive programming
- Java 17
- spring-boot 3.1.2
- SSL connection to Elasticsearch
- Filebeat (8.8.0) installation and uploading SpringBoot project logs, finally queryable in Kibana
Environment:
- GNU/Linux host with Docker installed
I've been really into reactive programming lately, wanting to write everything with it - like having a hammer and seeing everything as a nail. I happened to want to use ES (Elasticsearch) for some of my projects, so I decided to learn how to do fully reactive programming and ES CRUD. I encountered quite a few issues along the way. Since there's a lot of content, I'll explain each part in several sections.
2. Installing the Latest Elasticsearch (8.8.0) and Kibana (8.8.0)
I don't need to introduce what Elasticsearch is, right? It can query billions of records in milliseconds.
The official installation documentation is here: run-elasticsearch-locally
TL;DR - here's the simplified version:
2.1 Create Directories for ES Data Storage, Plugins, and Logs
mkdir /dockerData/elasticsearch/data
mkdir /dockerData/elasticsearch/plugins
mkdir /dockerData/elasticsearch/logs
2.2 Run ES Container
Create a network for interaction with Kibana:
docker network create elastic
Pull the specified version image:
docker pull docker.elastic.co/elasticsearch/elasticsearch:8.8.0
Run the container:
docker run -d \
    --name elasticsearch \
    -e "ES_JAVA_OPTS=-Xms4096m -Xmx4096m" \
    -e "discovery.type=single-node" \
   -v /dockerData/elasticsearch/data:/usr/share/elasticsearch/data \
   -v /dockerData/elasticsearch/plugins:/usr/share/elasticsearch/plugins \
    -v /dockerData/elasticsearch/logs:/usr/share/elasticsearch/logs \
    --privileged \
    --network elastic \
    -p 9200:9200 \
    -p 9300:9300 \
docker.elastic.co/elasticsearch/elasticsearch:8.8.0
-d: Run the container in "detached mode" (background mode). The container keeps running even if you close the terminal or exit the SSH session.--name elasticsearch: Specify the container name as "elasticsearch" for easier management and access later.-e "ES_JAVA_OPTS=-Xms4096m -Xmx4096m": Set Elasticsearch's JVM options. Here, initial heap memory (Xms) and maximum heap memory (Xmx) are set to 4GB (4096MB). Adjust according to your machine.-e "discovery.type=single-node": Set Elasticsearch's node discovery type to single-node, meaning Elasticsearch will run as a standalone node rather than part of a cluster.-v /dockerData/elasticsearch/data:/usr/share/elasticsearch/data: Mount the host's/dockerData/elasticsearch/datadirectory to the container's/usr/share/elasticsearch/datadirectory for persistent Elasticsearch data storage.-v /dockerData/elasticsearch/plugins:/usr/share/elasticsearch/plugins: Mount the host's/dockerData/elasticsearch/pluginsdirectory to the container's/usr/share/elasticsearch/pluginsdirectory for storing Elasticsearch plugins.-v /dockerData/elasticsearch/logs:/usr/share/elasticsearch/logs: Mount the host's/dockerData/elasticsearch/logsdirectory to the container's/usr/share/elasticsearch/logsdirectory for storing Elasticsearch log files.--privileged: Run the container in privileged mode, which may be necessary for certain special requirements.--network elastic: Connect the container to the Docker network named "elastic", typically used to connect Elasticsearch, Kibana, and other Elastic Stack components.-p 9200:9200: Map host port 9200 to container port 9200 for accessing Elasticsearch's HTTP API.-p 9300:9300: Map host port 9300 to container port 9300 for Elasticsearch inter-node communication (cluster communication).docker.elastic.co/elasticsearch/elasticsearch:8.8.0: Specify the Elasticsearch Docker image and version to use, here using version8.8.0.
Those who have installed ES before might ask: since I'm using "detached mode" directly, how do I see the token generated the first time? Don't worry, there's a new method now, which I'll explain when installing Kibana.
2.3 Run Kibana Container
Just these two lines. Note that I'm not running this Kibana in background mode, to make it easier to see the generated verification code.
docker pull docker.elastic.co/kibana/kibana:8.8.0
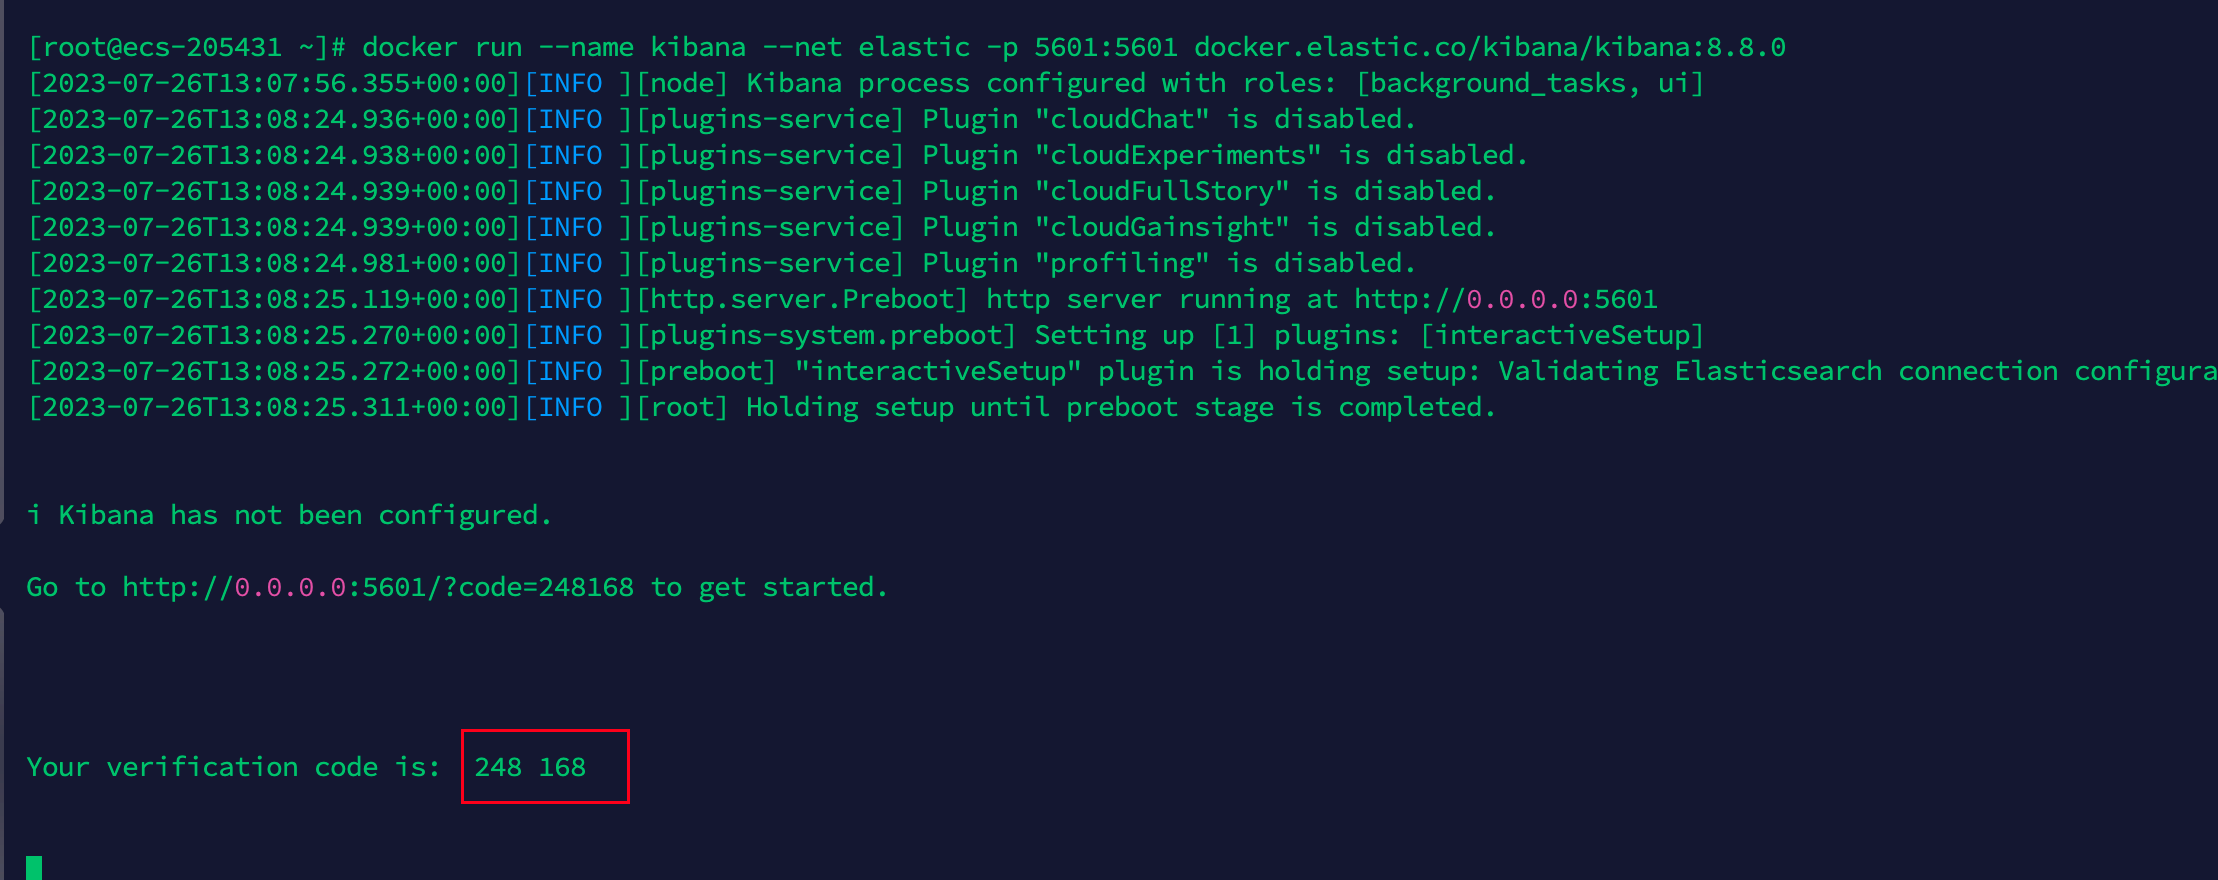
docker run --name kibana --net elastic -p 5601:5601 docker.elastic.co/kibana/kibana:8.8.0
After the Kibana container runs, open ip:5601 in your browser. If you're using a cloud service, don't forget to configure security group rules. You'll see that we need to enter the ES token.
Open a new terminal, connect to the server, and enter the following command to access the container's terminal:
docker exec -it elasticsearch /bin/bash
Then regenerate a token with the following command:
bin/elasticsearch-create-enrollment-token --scope kibana
You'll see the terminal generate a token. Copy this token to the Kibana page in your browser. Note it down first.
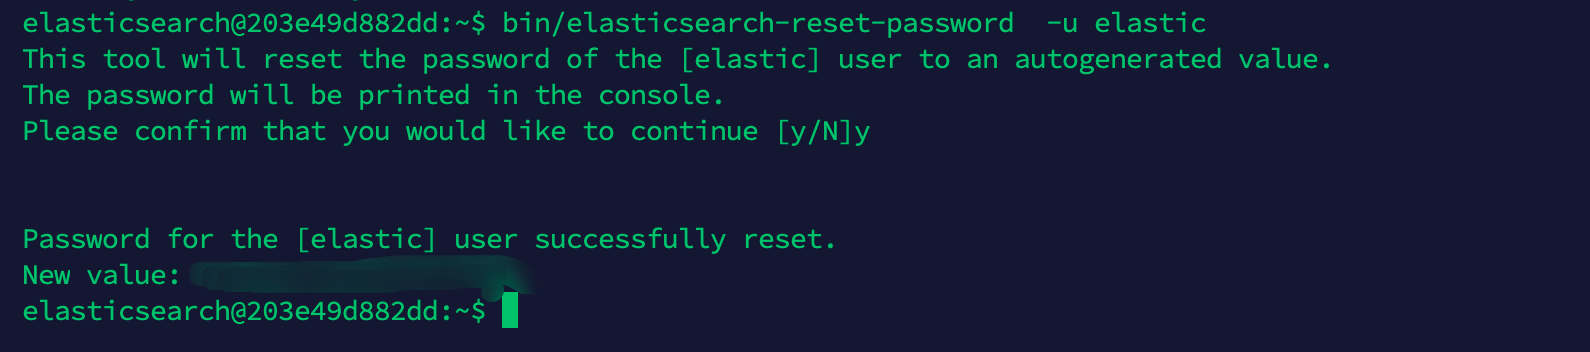
You also need to generate a password with the following command. Note it down - you'll need it to log into Kibana:
bin/elasticsearch-reset-password -u elastic
As shown:
Enter the token:
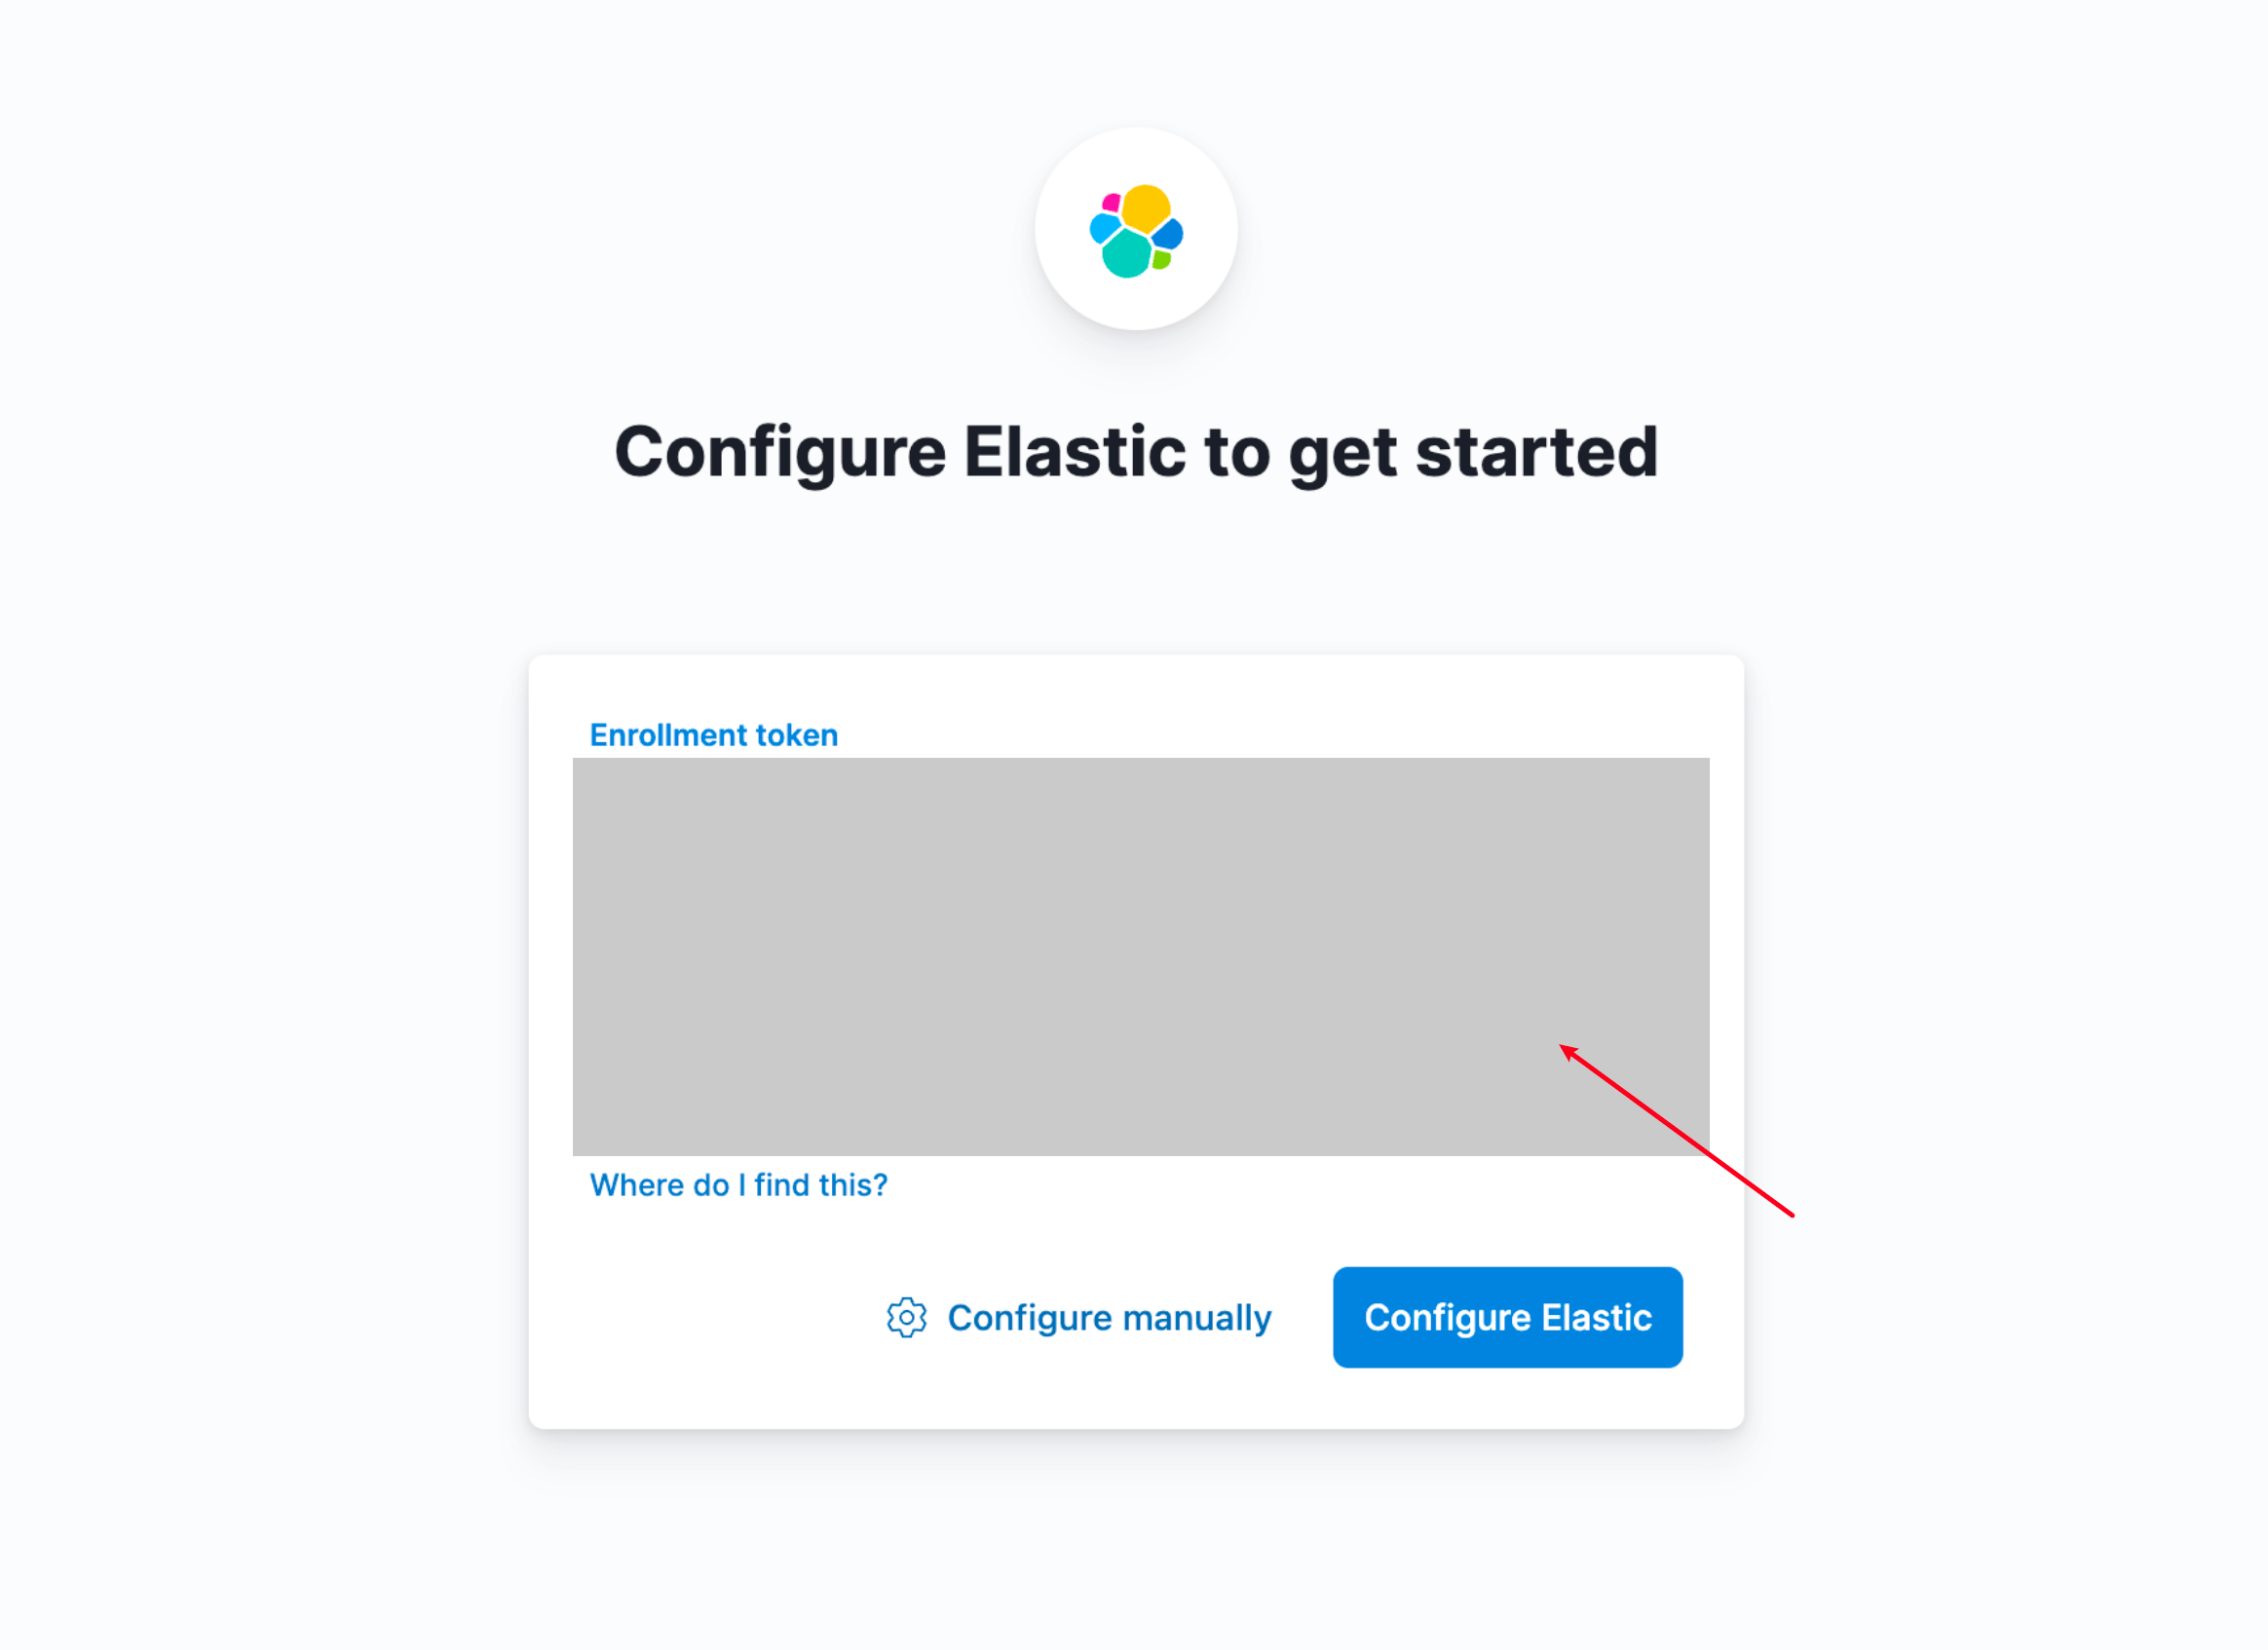
After entering, click Configure Elastic, and you'll see we need to enter a verification code.
This verification code can be found in the terminal where you opened Kibana, as shown below:
After entering, you'll need the password we just generated to log into Kibana.
At this point, ES and Kibana installation is complete. You can explore what's interesting in the new version of ES.